
Advertisement
- United States
- /
- Life Sciences
- /
- NasdaqGS:PACB
Further Upside For Pacific Biosciences of California, Inc. (NASDAQ:PACB) Shares Could Introduce Price Risks After 38% Bounce
Pacific Biosciences of California, Inc. (NASDAQ:PACB) shareholders would be excited to see that the share price has had a great month, posting a 38% gain and recovering from prior weakness. Unfortunately, the gains of the last month did little to right the losses of the last year with the stock still down 21% over that time.
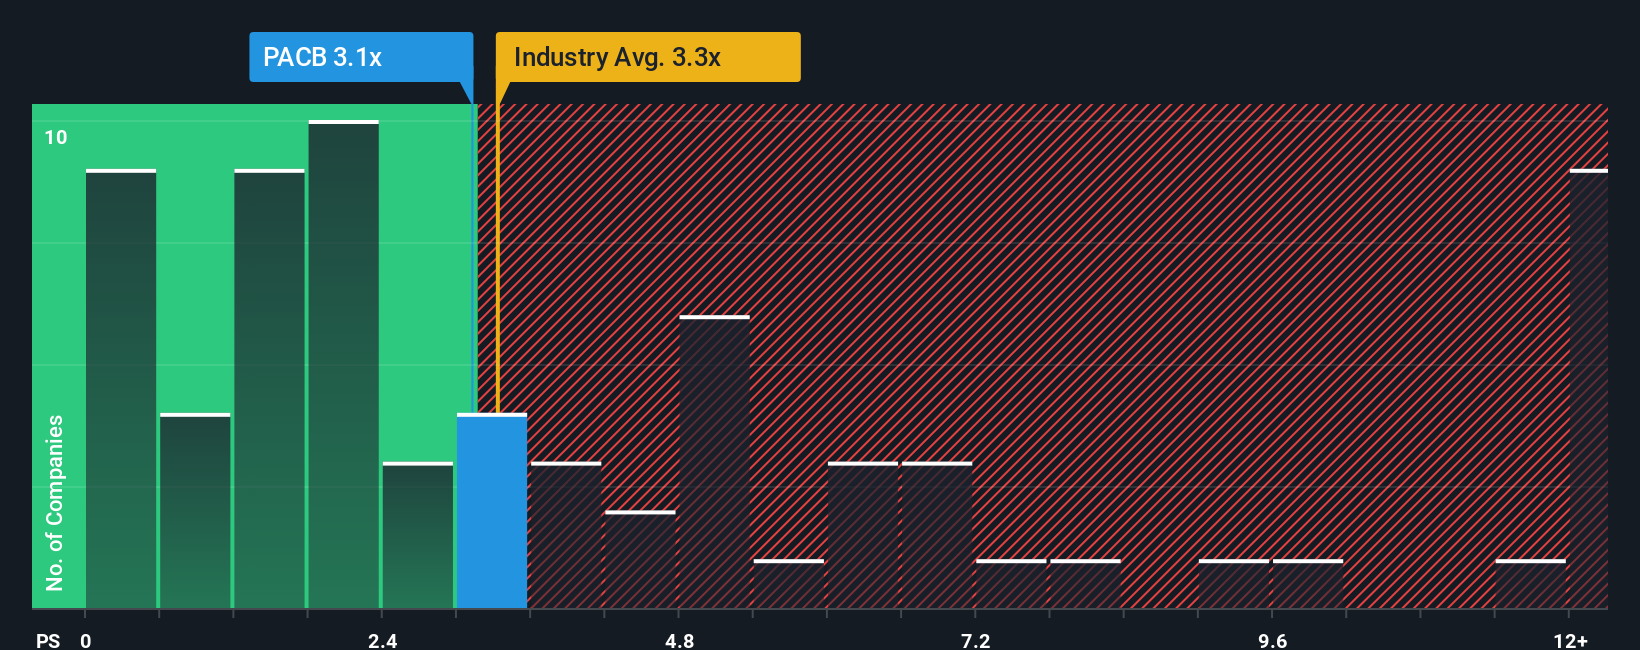
Although its price has surged higher, there still wouldn't be many who think Pacific Biosciences of California's price-to-sales (or "P/S") ratio of 3.1x is worth a mention when the median P/S in the United States' Life Sciences industry is similar at about 3.3x. Although, it's not wise to simply ignore the P/S without explanation as investors may be disregarding a distinct opportunity or a costly mistake.
See our latest analysis for Pacific Biosciences of California
How Pacific Biosciences of California Has Been Performing
While the industry has experienced revenue growth lately, Pacific Biosciences of California's revenue has gone into reverse gear, which is not great. One possibility is that the P/S ratio is moderate because investors think this poor revenue performance will turn around. If not, then existing shareholders may be a little nervous about the viability of the share price.
If you'd like to see what analysts are forecasting going forward, you should check out our free report on Pacific Biosciences of California.What Are Revenue Growth Metrics Telling Us About The P/S?
There's an inherent assumption that a company should be matching the industry for P/S ratios like Pacific Biosciences of California's to be considered reasonable.
Retrospectively, the last year delivered a frustrating 17% decrease to the company's top line. That put a dampener on the good run it was having over the longer-term as its three-year revenue growth is still a noteworthy 12% in total. Accordingly, while they would have preferred to keep the run going, shareholders would be roughly satisfied with the medium-term rates of revenue growth.
Looking ahead now, revenue is anticipated to climb by 15% per year during the coming three years according to the nine analysts following the company. With the industry only predicted to deliver 7.1% per annum, the company is positioned for a stronger revenue result.
With this in consideration, we find it intriguing that Pacific Biosciences of California's P/S is closely matching its industry peers. Apparently some shareholders are skeptical of the forecasts and have been accepting lower selling prices.
The Bottom Line On Pacific Biosciences of California's P/S
Pacific Biosciences of California's stock has a lot of momentum behind it lately, which has brought its P/S level with the rest of the industry. We'd say the price-to-sales ratio's power isn't primarily as a valuation instrument but rather to gauge current investor sentiment and future expectations.
Despite enticing revenue growth figures that outpace the industry, Pacific Biosciences of California's P/S isn't quite what we'd expect. When we see a strong revenue outlook, with growth outpacing the industry, we can only assume potential uncertainty around these figures are what might be placing slight pressure on the P/S ratio. However, if you agree with the analysts' forecasts, you may be able to pick up the stock at an attractive price.
And what about other risks? Every company has them, and we've spotted 2 warning signs for Pacific Biosciences of California you should know about.
Of course, profitable companies with a history of great earnings growth are generally safer bets. So you may wish to see this free collection of other companies that have reasonable P/E ratios and have grown earnings strongly.
New: Manage All Your Stock Portfolios in One Place
We've created the ultimate portfolio companion for stock investors, and it's free.
• Connect an unlimited number of Portfolios and see your total in one currency
• Be alerted to new Warning Signs or Risks via email or mobile
• Track the Fair Value of your stocks
Have feedback on this article? Concerned about the content? Get in touch with us directly. Alternatively, email editorial-team (at) simplywallst.com.
This article by Simply Wall St is general in nature. We provide commentary based on historical data and analyst forecasts only using an unbiased methodology and our articles are not intended to be financial advice. It does not constitute a recommendation to buy or sell any stock, and does not take account of your objectives, or your financial situation. We aim to bring you long-term focused analysis driven by fundamental data. Note that our analysis may not factor in the latest price-sensitive company announcements or qualitative material. Simply Wall St has no position in any stocks mentioned.
About NasdaqGS:PACB
Pacific Biosciences of California
Designs, develops, and manufactures sequencing solution to resolve genetically complex problems.
Fair value with imperfect balance sheet.
Similar Companies
Market Insights

Advertisement
Community Narratives
A formidable player in AI and enterprise computing.
Fair Value US$210.00|3.1% overvalued
CO
Community Contributor
IREN's Bold Moves in Sustainable Bitcoin Mining & AI Data Centers
Fair Value US$72.52|11.6% undervalued
BL
Community Contributor
Cooling the Champions: The Aussie Tech Behind F1's Victories
Fair Value AU$12.40|39.4% undervalued
TR
Community Contributor