
Advertisement
- United States
- /
- Biotech
- /
- NasdaqGS:MYGN
Lacklustre Performance Is Driving Myriad Genetics, Inc.'s (NASDAQ:MYGN) 48% Price Drop
To the annoyance of some shareholders, Myriad Genetics, Inc. (NASDAQ:MYGN) shares are down a considerable 48% in the last month, which continues a horrid run for the company. For any long-term shareholders, the last month ends a year to forget by locking in a 84% share price decline.
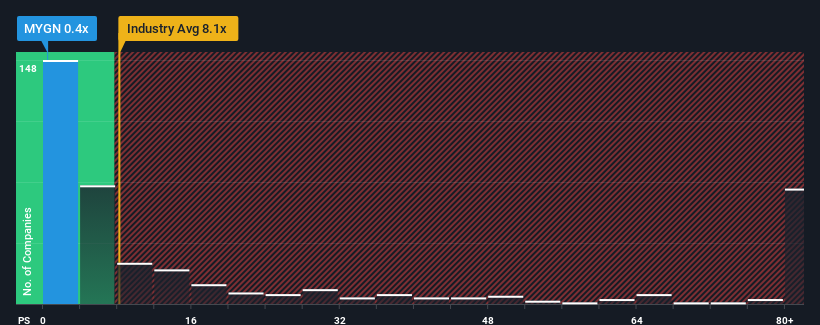
After such a large drop in price, Myriad Genetics may look like a strong buying opportunity at present with its price-to-sales (or "P/S") ratio of 0.4x, considering almost half of all companies in the Biotechs industry in the United States have P/S ratios greater than 8x and even P/S higher than 47x aren't out of the ordinary. However, the P/S might be quite low for a reason and it requires further investigation to determine if it's justified.
Our free stock report includes 2 warning signs investors should be aware of before investing in Myriad Genetics. Read for free now.Check out our latest analysis for Myriad Genetics
What Does Myriad Genetics' P/S Mean For Shareholders?
Myriad Genetics could be doing better as it's been growing revenue less than most other companies lately. Perhaps the market is expecting the current trend of poor revenue growth to continue, which has kept the P/S suppressed. If you still like the company, you'd be hoping revenue doesn't get any worse and that you could pick up some stock while it's out of favour.
Keen to find out how analysts think Myriad Genetics' future stacks up against the industry? In that case, our free report is a great place to start.What Are Revenue Growth Metrics Telling Us About The Low P/S?
Myriad Genetics' P/S ratio would be typical for a company that's expected to deliver very poor growth or even falling revenue, and importantly, perform much worse than the industry.
Taking a look back first, we see that the company managed to grow revenues by a handy 7.4% last year. The latest three year period has also seen a 22% overall rise in revenue, aided somewhat by its short-term performance. Therefore, it's fair to say the revenue growth recently has been respectable for the company.
Looking ahead now, revenue is anticipated to climb by 5.2% per year during the coming three years according to the analysts following the company. That's shaping up to be materially lower than the 157% per annum growth forecast for the broader industry.
In light of this, it's understandable that Myriad Genetics' P/S sits below the majority of other companies. Apparently many shareholders weren't comfortable holding on while the company is potentially eyeing a less prosperous future.
What Does Myriad Genetics' P/S Mean For Investors?
Myriad Genetics' P/S looks about as weak as its stock price lately. It's argued the price-to-sales ratio is an inferior measure of value within certain industries, but it can be a powerful business sentiment indicator.
As expected, our analysis of Myriad Genetics' analyst forecasts confirms that the company's underwhelming revenue outlook is a major contributor to its low P/S. Shareholders' pessimism on the revenue prospects for the company seems to be the main contributor to the depressed P/S. The company will need a change of fortune to justify the P/S rising higher in the future.
You always need to take note of risks, for example - Myriad Genetics has 2 warning signs we think you should be aware of.
It's important to make sure you look for a great company, not just the first idea you come across. So if growing profitability aligns with your idea of a great company, take a peek at this free list of interesting companies with strong recent earnings growth (and a low P/E).
New: Manage All Your Stock Portfolios in One Place
We've created the ultimate portfolio companion for stock investors, and it's free.
• Connect an unlimited number of Portfolios and see your total in one currency
• Be alerted to new Warning Signs or Risks via email or mobile
• Track the Fair Value of your stocks
Have feedback on this article? Concerned about the content? Get in touch with us directly. Alternatively, email editorial-team (at) simplywallst.com.
This article by Simply Wall St is general in nature. We provide commentary based on historical data and analyst forecasts only using an unbiased methodology and our articles are not intended to be financial advice. It does not constitute a recommendation to buy or sell any stock, and does not take account of your objectives, or your financial situation. We aim to bring you long-term focused analysis driven by fundamental data. Note that our analysis may not factor in the latest price-sensitive company announcements or qualitative material. Simply Wall St has no position in any stocks mentioned.
About NasdaqGS:MYGN
Myriad Genetics
A molecular diagnostic testing and precision medicine company, develops and provides molecular tests.
Excellent balance sheet and good value.
Similar Companies
Market Insights

Advertisement
Community Narratives
The Next Phase of Energy Storage: How NeoVolta Is Tackling America’s Power Crunch
Fair Value US$7.50|23.7% undervalued
MA
Community Contributor
A formidable player in AI and enterprise computing.
Fair Value US$210.00|0.7% overvalued
CO
Community Contributor
IREN's Bold Moves in Sustainable Bitcoin Mining & AI Data Centers
Fair Value US$72.52|14.9% undervalued
BL
Community Contributor
Cooling the Champions: The Aussie Tech Behind F1's Victories
Fair Value AU$12.40|38.1% undervalued
TR
Community Contributor