- United States
- /
- Biotech
- /
- NasdaqGM:MURA
We're Keeping An Eye On Mural Oncology's (NASDAQ:MURA) Cash Burn Rate


There's no doubt that money can be made by owning shares of unprofitable businesses. For example, although software-as-a-service business Salesforce.com lost money for years while it grew recurring revenue, if you held shares since 2005, you'd have done very well indeed. But while the successes are well known, investors should not ignore the very many unprofitable companies that simply burn through all their cash and collapse.
So, the natural question for Mural Oncology (NASDAQ:MURA) shareholders is whether they should be concerned by its rate of cash burn. In this article, we define cash burn as its annual (negative) free cash flow, which is the amount of money a company spends each year to fund its growth. We'll start by comparing its cash burn with its cash reserves in order to calculate its cash runway.
View our latest analysis for Mural Oncology
Does Mural Oncology Have A Long Cash Runway?
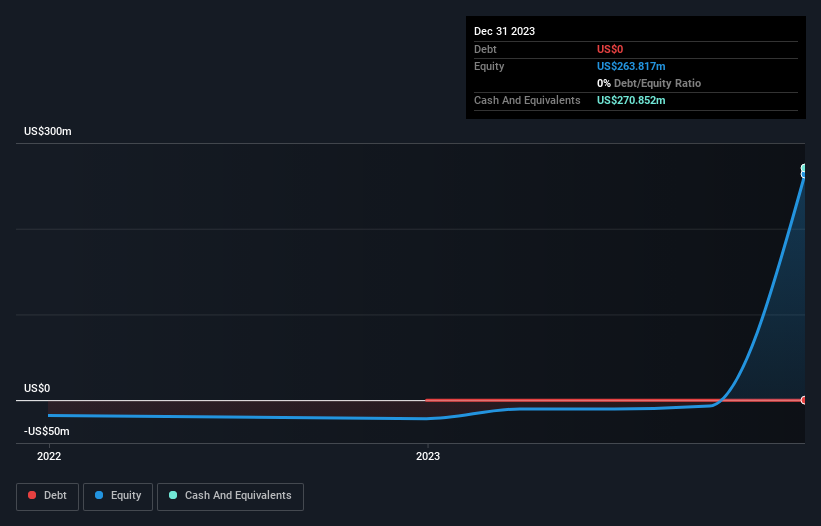
A cash runway is defined as the length of time it would take a company to run out of money if it kept spending at its current rate of cash burn. As at December 2023, Mural Oncology had cash of US$271m and no debt. In the last year, its cash burn was US$192m. Therefore, from December 2023 it had roughly 17 months of cash runway. That's not too bad, but it's fair to say the end of the cash runway is in sight, unless cash burn reduces drastically. Depicted below, you can see how its cash holdings have changed over time.
How Is Mural Oncology's Cash Burn Changing Over Time?
Because Mural Oncology isn't currently generating revenue, we consider it an early-stage business. So while we can't look to sales to understand growth, we can look at how the cash burn is changing to understand how expenditure is trending over time. With the cash burn rate up 10% in the last year, it seems that the company is ratcheting up investment in the business over time. That's not necessarily a bad thing, but investors should be mindful of the fact that will shorten the cash runway. Admittedly, we're a bit cautious of Mural Oncology due to its lack of significant operating revenues. We prefer most of the stocks on this list of stocks that analysts expect to grow.
How Hard Would It Be For Mural Oncology To Raise More Cash For Growth?
Given its cash burn trajectory, Mural Oncology shareholders may wish to consider how easily it could raise more cash, despite its solid cash runway. Companies can raise capital through either debt or equity. Commonly, a business will sell new shares in itself to raise cash and drive growth. By comparing a company's annual cash burn to its total market capitalisation, we can estimate roughly how many shares it would have to issue in order to run the company for another year (at the same burn rate).
Since it has a market capitalisation of US$84m, Mural Oncology's US$192m in cash burn equates to about 229% of its market value. That suggests the company may have some funding difficulties, and we'd be very wary of the stock.
Is Mural Oncology's Cash Burn A Worry?
Even though its cash burn relative to its market cap makes us a little nervous, we are compelled to mention that we thought Mural Oncology's cash runway was relatively promising. After looking at that range of measures, we think shareholders should be extremely attentive to how the company is using its cash, as the cash burn makes us uncomfortable. Separately, we looked at different risks affecting the company and spotted 2 warning signs for Mural Oncology (of which 1 is a bit concerning!) you should know about.
If you would prefer to check out another company with better fundamentals, then do not miss this free list of interesting companies, that have HIGH return on equity and low debt or this list of stocks which are all forecast to grow.
New: Manage All Your Stock Portfolios in One Place
We've created the ultimate portfolio companion for stock investors, and it's free.
• Connect an unlimited number of Portfolios and see your total in one currency
• Be alerted to new Warning Signs or Risks via email or mobile
• Track the Fair Value of your stocks
Have feedback on this article? Concerned about the content? Get in touch with us directly. Alternatively, email editorial-team (at) simplywallst.com.
This article by Simply Wall St is general in nature. We provide commentary based on historical data and analyst forecasts only using an unbiased methodology and our articles are not intended to be financial advice. It does not constitute a recommendation to buy or sell any stock, and does not take account of your objectives, or your financial situation. We aim to bring you long-term focused analysis driven by fundamental data. Note that our analysis may not factor in the latest price-sensitive company announcements or qualitative material. Simply Wall St has no position in any stocks mentioned.
About NasdaqGM:MURA
Mural Oncology
Operates as a clinical-stage oncology company that focuses on discovering and developing immunotherapies for the treatment of patients with cancer.
Adequate balance sheet slight.
Market Insights

Community Narratives


