- United States
- /
- Biotech
- /
- NasdaqCM:MRKR
Here's Why We're Watching Marker Therapeutics' (NASDAQ:MRKR) Cash Burn Situation


We can readily understand why investors are attracted to unprofitable companies. For example, although Amazon.com made losses for many years after listing, if you had bought and held the shares since 1999, you would have made a fortune. Nonetheless, only a fool would ignore the risk that a loss making company burns through its cash too quickly.
So should Marker Therapeutics (NASDAQ:MRKR) shareholders be worried about its cash burn? In this report, we will consider the company's annual negative free cash flow, henceforth referring to it as the 'cash burn'. Let's start with an examination of the business' cash, relative to its cash burn.
See our latest analysis for Marker Therapeutics
Does Marker Therapeutics Have A Long Cash Runway?
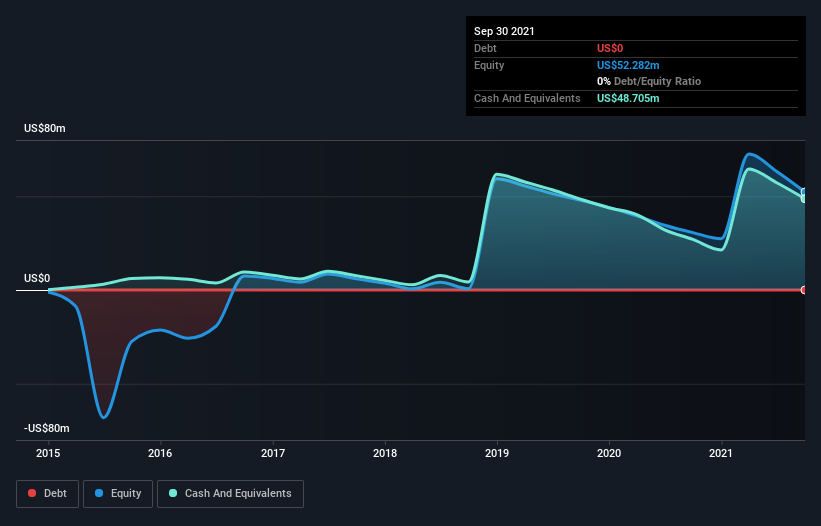
You can calculate a company's cash runway by dividing the amount of cash it has by the rate at which it is spending that cash. In September 2021, Marker Therapeutics had US$49m in cash, and was debt-free. Looking at the last year, the company burnt through US$35m. Therefore, from September 2021 it had roughly 17 months of cash runway. While that cash runway isn't too concerning, sensible holders would be peering into the distance, and considering what happens if the company runs out of cash. You can see how its cash balance has changed over time in the image below.
How Is Marker Therapeutics' Cash Burn Changing Over Time?
Marker Therapeutics didn't record any revenue over the last year, indicating that it's an early stage company still developing its business. So while we can't look to sales to understand growth, we can look at how the cash burn is changing to understand how expenditure is trending over time. With the cash burn rate up 43% in the last year, it seems that the company is ratcheting up investment in the business over time. That's not necessarily a bad thing, but investors should be mindful of the fact that will shorten the cash runway. Clearly, however, the crucial factor is whether the company will grow its business going forward. So you might want to take a peek at how much the company is expected to grow in the next few years.
Can Marker Therapeutics Raise More Cash Easily?
Given its cash burn trajectory, Marker Therapeutics shareholders may wish to consider how easily it could raise more cash, despite its solid cash runway. Issuing new shares, or taking on debt, are the most common ways for a listed company to raise more money for its business. Commonly, a business will sell new shares in itself to raise cash and drive growth. We can compare a company's cash burn to its market capitalisation to get a sense for how many new shares a company would have to issue to fund one year's operations.
Marker Therapeutics has a market capitalisation of US$105m and burnt through US$35m last year, which is 33% of the company's market value. That's not insignificant, and if the company had to sell enough shares to fund another year's growth at the current share price, you'd likely witness fairly costly dilution.
So, Should We Worry About Marker Therapeutics' Cash Burn?
Even though its cash burn relative to its market cap makes us a little nervous, we are compelled to mention that we thought Marker Therapeutics' cash runway was relatively promising. Summing up, we think the Marker Therapeutics' cash burn is a risk, based on the factors we mentioned in this article. Separately, we looked at different risks affecting the company and spotted 5 warning signs for Marker Therapeutics (of which 3 shouldn't be ignored!) you should know about.
Of course, you might find a fantastic investment by looking elsewhere. So take a peek at this free list of interesting companies, and this list of stocks growth stocks (according to analyst forecasts)
If you're looking to trade Marker Therapeutics, open an account with the lowest-cost platform trusted by professionals, Interactive Brokers.
With clients in over 200 countries and territories, and access to 160 markets, IBKR lets you trade stocks, options, futures, forex, bonds and funds from a single integrated account.
Enjoy no hidden fees, no account minimums, and FX conversion rates as low as 0.03%, far better than what most brokers offer.
Sponsored ContentNew: Manage All Your Stock Portfolios in One Place
We've created the ultimate portfolio companion for stock investors, and it's free.
• Connect an unlimited number of Portfolios and see your total in one currency
• Be alerted to new Warning Signs or Risks via email or mobile
• Track the Fair Value of your stocks
This article by Simply Wall St is general in nature. We provide commentary based on historical data and analyst forecasts only using an unbiased methodology and our articles are not intended to be financial advice. It does not constitute a recommendation to buy or sell any stock, and does not take account of your objectives, or your financial situation. We aim to bring you long-term focused analysis driven by fundamental data. Note that our analysis may not factor in the latest price-sensitive company announcements or qualitative material. Simply Wall St has no position in any stocks mentioned.
Have feedback on this article? Concerned about the content? Get in touch with us directly. Alternatively, email editorial-team (at) simplywallst.com.
About NasdaqCM:MRKR
Marker Therapeutics
A clinical-stage immuno-oncology company, engages in the development and commercialization of novel T cell-based immunotherapies for the treatment of hematological malignancies and solid tumor indications.
Excellent balance sheet moderate.
Market Insights

Community Narratives


