
Advertisement
- United States
- /
- Biotech
- /
- NasdaqCM:INTS
We're Hopeful That Intensity Therapeutics (NASDAQ:INTS) Will Use Its Cash Wisely

We can readily understand why investors are attracted to unprofitable companies. For example, although Amazon.com made losses for many years after listing, if you had bought and held the shares since 1999, you would have made a fortune. But the harsh reality is that very many loss making companies burn through all their cash and go bankrupt.
Given this risk, we thought we'd take a look at whether Intensity Therapeutics (NASDAQ:INTS) shareholders should be worried about its cash burn. In this article, we define cash burn as its annual (negative) free cash flow, which is the amount of money a company spends each year to fund its growth. First, we'll determine its cash runway by comparing its cash burn with its cash reserves.
See our latest analysis for Intensity Therapeutics
Does Intensity Therapeutics Have A Long Cash Runway?
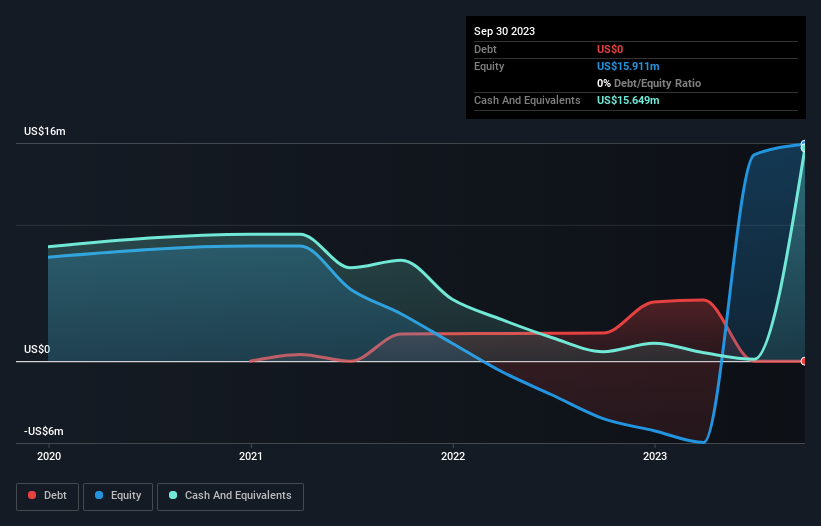
You can calculate a company's cash runway by dividing the amount of cash it has by the rate at which it is spending that cash. As at September 2023, Intensity Therapeutics had cash of US$16m and no debt. In the last year, its cash burn was US$7.9m. That means it had a cash runway of about 2.0 years as of September 2023. That's not too bad, but it's fair to say the end of the cash runway is in sight, unless cash burn reduces drastically. Depicted below, you can see how its cash holdings have changed over time.
How Is Intensity Therapeutics' Cash Burn Changing Over Time?
Because Intensity Therapeutics isn't currently generating revenue, we consider it an early-stage business. Nonetheless, we can still examine its cash burn trajectory as part of our assessment of its cash burn situation. With the cash burn rate up 18% in the last year, it seems that the company is ratcheting up investment in the business over time. However, the company's true cash runway will therefore be shorter than suggested above, if spending continues to increase. While the past is always worth studying, it is the future that matters most of all. For that reason, it makes a lot of sense to take a look at our analyst forecasts for the company.
Can Intensity Therapeutics Raise More Cash Easily?
Given its cash burn trajectory, Intensity Therapeutics shareholders may wish to consider how easily it could raise more cash, despite its solid cash runway. Generally speaking, a listed business can raise new cash through issuing shares or taking on debt. Commonly, a business will sell new shares in itself to raise cash and drive growth. By looking at a company's cash burn relative to its market capitalisation, we gain insight on how much shareholders would be diluted if the company needed to raise enough cash to cover another year's cash burn.
Intensity Therapeutics has a market capitalisation of US$92m and burnt through US$7.9m last year, which is 8.6% of the company's market value. Given that is a rather small percentage, it would probably be really easy for the company to fund another year's growth by issuing some new shares to investors, or even by taking out a loan.
So, Should We Worry About Intensity Therapeutics' Cash Burn?
On this analysis of Intensity Therapeutics' cash burn, we think its cash burn relative to its market cap was reassuring, while its increasing cash burn has us a bit worried. Considering all the factors discussed in this article, we're not overly concerned about the company's cash burn, although we do think shareholders should keep an eye on how it develops. On another note, Intensity Therapeutics has 4 warning signs (and 2 which are a bit unpleasant) we think you should know about.
Of course Intensity Therapeutics may not be the best stock to buy. So you may wish to see this free collection of companies boasting high return on equity, or this list of stocks that insiders are buying.
New: AI Stock Screener & Alerts
Our new AI Stock Screener scans the market every day to uncover opportunities.
• Dividend Powerhouses (3%+ Yield)
• Undervalued Small Caps with Insider Buying
• High growth Tech and AI Companies
Or build your own from over 50 metrics.
Have feedback on this article? Concerned about the content? Get in touch with us directly. Alternatively, email editorial-team (at) simplywallst.com.
This article by Simply Wall St is general in nature. We provide commentary based on historical data and analyst forecasts only using an unbiased methodology and our articles are not intended to be financial advice. It does not constitute a recommendation to buy or sell any stock, and does not take account of your objectives, or your financial situation. We aim to bring you long-term focused analysis driven by fundamental data. Note that our analysis may not factor in the latest price-sensitive company announcements or qualitative material. Simply Wall St has no position in any stocks mentioned.
About NasdaqCM:INTS
Intensity Therapeutics
A late-stage clinical biotechnology company, engages in the provision of treatment for the regional and systemic nature of cancer in the United States.
Flawless balance sheet slight.
Market Insights

Advertisement
Community Narratives
Groundbreaking therapies that could change the treatment landscape for PTSD, fibromyalgia, MS & Alzheimer’s
Fair Value US$6.20|86.9% undervalued
CM
Community Contributor
DigitalOcean Will Grow 14% by Embracing AI with Paperspace Acquisition
Fair Value US$50.00|41.7% undervalued
NE
Community Contributor
Viant Technology: A Rising AdTech Challenger in the AI-Powered CTV Market
Fair Value US$38.61|63.2% undervalued
BL
Community Contributor
Volvo will Accelerate Forward into Electric and Autonomous Leadership in Five Years
Fair Value SEK 438.80|39.7% undervalued
UN
Community Contributor