

David Iben put it well when he said, 'Volatility is not a risk we care about. What we care about is avoiding the permanent loss of capital.' When we think about how risky a company is, we always like to look at its use of debt, since debt overload can lead to ruin. We note that Heron Therapeutics, Inc. (NASDAQ:HRTX) does have debt on its balance sheet. But should shareholders be worried about its use of debt?
When Is Debt A Problem?
Debt is a tool to help businesses grow, but if a business is incapable of paying off its lenders, then it exists at their mercy. If things get really bad, the lenders can take control of the business. However, a more usual (but still expensive) situation is where a company must dilute shareholders at a cheap share price simply to get debt under control. Having said that, the most common situation is where a company manages its debt reasonably well - and to its own advantage. The first step when considering a company's debt levels is to consider its cash and debt together.
Check out our latest analysis for Heron Therapeutics
How Much Debt Does Heron Therapeutics Carry?
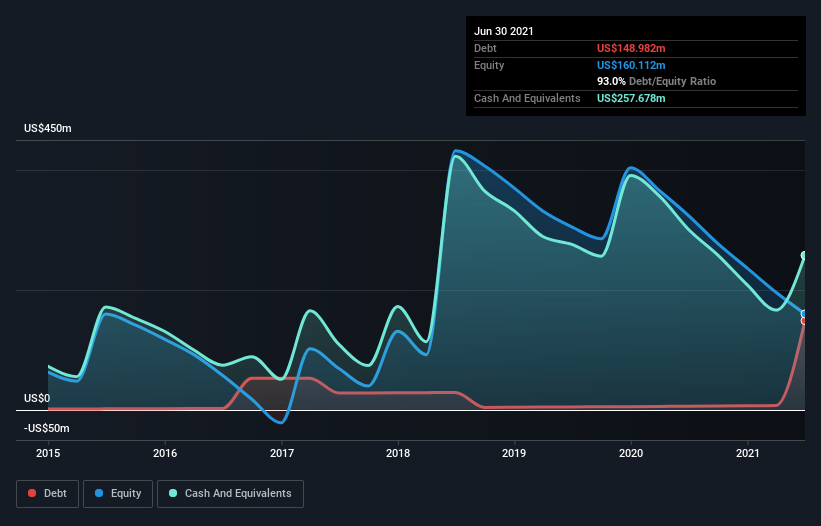
You can click the graphic below for the historical numbers, but it shows that as of June 2021 Heron Therapeutics had US$149.0m of debt, an increase on US$6.27m, over one year. But it also has US$257.7m in cash to offset that, meaning it has US$108.7m net cash.
A Look At Heron Therapeutics' Liabilities
Zooming in on the latest balance sheet data, we can see that Heron Therapeutics had liabilities of US$82.1m due within 12 months and liabilities of US$162.0m due beyond that. Offsetting this, it had US$257.7m in cash and US$42.6m in receivables that were due within 12 months. So it can boast US$56.2m more liquid assets than total liabilities.
This short term liquidity is a sign that Heron Therapeutics could probably pay off its debt with ease, as its balance sheet is far from stretched. Succinctly put, Heron Therapeutics boasts net cash, so it's fair to say it does not have a heavy debt load! The balance sheet is clearly the area to focus on when you are analysing debt. But it is future earnings, more than anything, that will determine Heron Therapeutics's ability to maintain a healthy balance sheet going forward. So if you want to see what the professionals think, you might find this free report on analyst profit forecasts to be interesting.
Over 12 months, Heron Therapeutics made a loss at the EBIT level, and saw its revenue drop to US$83m, which is a fall of 34%. That makes us nervous, to say the least.
So How Risky Is Heron Therapeutics?
Statistically speaking companies that lose money are riskier than those that make money. And we do note that Heron Therapeutics had an earnings before interest and tax (EBIT) loss, over the last year. And over the same period it saw negative free cash outflow of US$204m and booked a US$234m accounting loss. While this does make the company a bit risky, it's important to remember it has net cash of US$108.7m. That means it could keep spending at its current rate for more than two years. Even though its balance sheet seems sufficiently liquid, debt always makes us a little nervous if a company doesn't produce free cash flow regularly. There's no doubt that we learn most about debt from the balance sheet. However, not all investment risk resides within the balance sheet - far from it. For example, we've discovered 3 warning signs for Heron Therapeutics that you should be aware of before investing here.
When all is said and done, sometimes its easier to focus on companies that don't even need debt. Readers can access a list of growth stocks with zero net debt 100% free, right now.
Valuation is complex, but we're here to simplify it.
Discover if Heron Therapeutics might be undervalued or overvalued with our detailed analysis, featuring fair value estimates, potential risks, dividends, insider trades, and its financial condition.
Access Free AnalysisThis article by Simply Wall St is general in nature. We provide commentary based on historical data and analyst forecasts only using an unbiased methodology and our articles are not intended to be financial advice. It does not constitute a recommendation to buy or sell any stock, and does not take account of your objectives, or your financial situation. We aim to bring you long-term focused analysis driven by fundamental data. Note that our analysis may not factor in the latest price-sensitive company announcements or qualitative material. Simply Wall St has no position in any stocks mentioned.
Have feedback on this article? Concerned about the content? Get in touch with us directly. Alternatively, email editorial-team (at) simplywallst.com.
About NasdaqCM:HRTX
Heron Therapeutics
A commercial-stage biotechnology company, focuses on enhancing the lives of patients by developing and commercializing therapeutic that enhances medical care.
Undervalued with reasonable growth potential.
