
Advertisement

There's no doubt that money can be made by owning shares of unprofitable businesses. For example, although software-as-a-service business Salesforce.com lost money for years while it grew recurring revenue, if you held shares since 2005, you'd have done very well indeed. Nonetheless, only a fool would ignore the risk that a loss making company burns through its cash too quickly.
So, the natural question for Genelux (NASDAQ:GNLX) shareholders is whether they should be concerned by its rate of cash burn. For the purpose of this article, we'll define cash burn as the amount of cash the company is spending each year to fund its growth (also called its negative free cash flow). Let's start with an examination of the business' cash, relative to its cash burn.
View our latest analysis for Genelux
Does Genelux Have A Long Cash Runway?
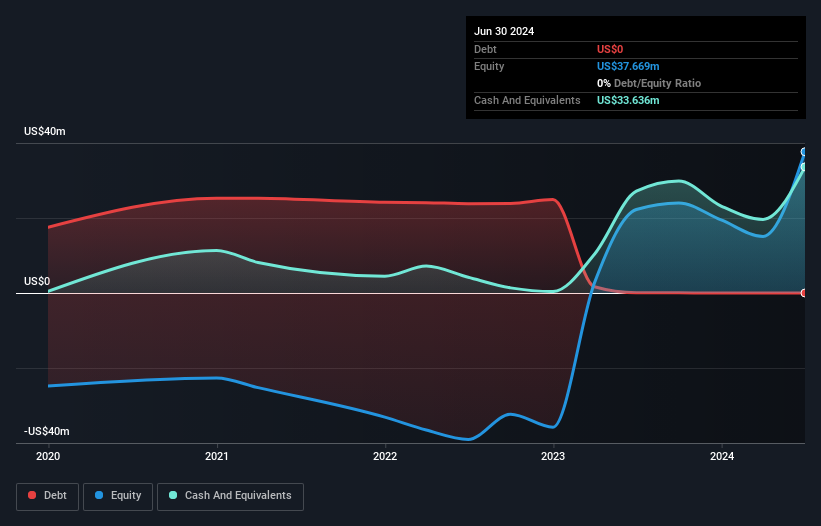
A company's cash runway is calculated by dividing its cash hoard by its cash burn. As at June 2024, Genelux had cash of US$34m and no debt. Looking at the last year, the company burnt through US$22m. Therefore, from June 2024 it had roughly 18 months of cash runway. Notably, analysts forecast that Genelux will break even (at a free cash flow level) in about 4 years. Essentially, that means the company will either reduce its cash burn, or else require more cash. The image below shows how its cash balance has been changing over the last few years.
How Is Genelux's Cash Burn Changing Over Time?
In our view, Genelux doesn't yet produce significant amounts of operating revenue, since it reported just US$8.0k in the last twelve months. Therefore, for the purposes of this analysis we'll focus on how the cash burn is tracking. During the last twelve months, its cash burn actually ramped up 53%. Oftentimes, increased cash burn simply means a company is accelerating its business development, but one should always be mindful that this causes the cash runway to shrink. While the past is always worth studying, it is the future that matters most of all. So you might want to take a peek at how much the company is expected to grow in the next few years.
How Easily Can Genelux Raise Cash?
Given its cash burn trajectory, Genelux shareholders may wish to consider how easily it could raise more cash, despite its solid cash runway. Companies can raise capital through either debt or equity. One of the main advantages held by publicly listed companies is that they can sell shares to investors to raise cash and fund growth. We can compare a company's cash burn to its market capitalisation to get a sense for how many new shares a company would have to issue to fund one year's operations.
Genelux's cash burn of US$22m is about 30% of its US$75m market capitalisation. That's fairly notable cash burn, so if the company had to sell shares to cover the cost of another year's operations, shareholders would suffer some costly dilution.
Is Genelux's Cash Burn A Worry?
On this analysis of Genelux's cash burn, we think its cash runway was reassuring, while its increasing cash burn has us a bit worried. One real positive is that analysts are forecasting that the company will reach breakeven. Even though we don't think it has a problem with its cash burn, the analysis we've done in this article does suggest that shareholders should give some careful thought to the potential cost of raising more money in the future. On another note, Genelux has 6 warning signs (and 3 which make us uncomfortable) we think you should know about.
Of course, you might find a fantastic investment by looking elsewhere. So take a peek at this free list of interesting companies, and this list of stocks growth stocks (according to analyst forecasts)
New: Manage All Your Stock Portfolios in One Place
We've created the ultimate portfolio companion for stock investors, and it's free.
• Connect an unlimited number of Portfolios and see your total in one currency
• Be alerted to new Warning Signs or Risks via email or mobile
• Track the Fair Value of your stocks
Have feedback on this article? Concerned about the content? Get in touch with us directly. Alternatively, email editorial-team (at) simplywallst.com.
This article by Simply Wall St is general in nature. We provide commentary based on historical data and analyst forecasts only using an unbiased methodology and our articles are not intended to be financial advice. It does not constitute a recommendation to buy or sell any stock, and does not take account of your objectives, or your financial situation. We aim to bring you long-term focused analysis driven by fundamental data. Note that our analysis may not factor in the latest price-sensitive company announcements or qualitative material. Simply Wall St has no position in any stocks mentioned.
About NasdaqCM:GNLX
Genelux
A clinical-stage biopharmaceutical company, focuses on developing oncolytic viral immunotherapies for patients suffering from aggressive and/or difficult-to-treat solid tumor types.
Flawless balance sheet moderate.
Market Insights

Advertisement
Community Narratives
Scaling up in building materials with smart M&A and growing profitability
Fair Value US$2.77|30.0% undervalued
CM
Community Contributor
Hims: The Platform Powering Personalised Healthcare
Fair Value US$114.01|51.9% undervalued
BL
Community Contributor
Undervalued lottery company with strong fundamentals
Fair Value AU$15.00|34.5% undervalued
RO
Community Contributor
Proximus, transferring money from the impatient to the patient investor
Fair Value €16.62|55.1% undervalued
AX
Community Contributor