
Advertisement
Some say volatility, rather than debt, is the best way to think about risk as an investor, but Warren Buffett famously said that 'Volatility is far from synonymous with risk.' When we think about how risky a company is, we always like to look at its use of debt, since debt overload can lead to ruin. Importantly, Geron Corporation (NASDAQ:GERN) does carry debt. But the more important question is: how much risk is that debt creating?
Why Does Debt Bring Risk?
Debt and other liabilities become risky for a business when it cannot easily fulfill those obligations, either with free cash flow or by raising capital at an attractive price. In the worst case scenario, a company can go bankrupt if it cannot pay its creditors. While that is not too common, we often do see indebted companies permanently diluting shareholders because lenders force them to raise capital at a distressed price. Of course, the upside of debt is that it often represents cheap capital, especially when it replaces dilution in a company with the ability to reinvest at high rates of return. When we think about a company's use of debt, we first look at cash and debt together.
Check out our latest analysis for Geron
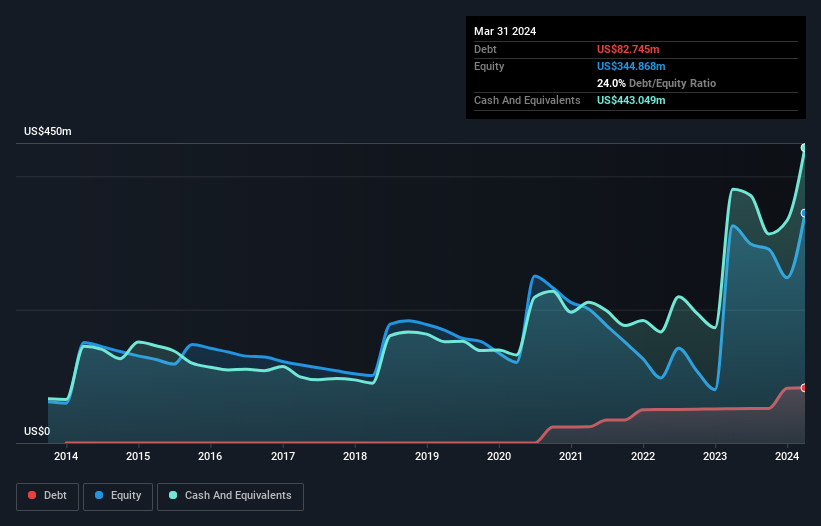
What Is Geron's Debt?
You can click the graphic below for the historical numbers, but it shows that as of March 2024 Geron had US$82.7m of debt, an increase on US$51.4m, over one year. However, its balance sheet shows it holds US$443.0m in cash, so it actually has US$360.3m net cash.
How Healthy Is Geron's Balance Sheet?
The latest balance sheet data shows that Geron had liabilities of US$123.2m due within a year, and liabilities of US$14.0m falling due after that. Offsetting these obligations, it had cash of US$443.0m as well as receivables valued at US$1.63m due within 12 months. So it can boast US$307.5m more liquid assets than total liabilities.
This short term liquidity is a sign that Geron could probably pay off its debt with ease, as its balance sheet is far from stretched. Simply put, the fact that Geron has more cash than debt is arguably a good indication that it can manage its debt safely. When analysing debt levels, the balance sheet is the obvious place to start. But ultimately the future profitability of the business will decide if Geron can strengthen its balance sheet over time. So if you want to see what the professionals think, you might find this free report on analyst profit forecasts to be interesting.
Over 12 months, Geron reported revenue of US$520k, which is a gain of 5.3%, although it did not report any earnings before interest and tax. We usually like to see faster growth from unprofitable companies, but each to their own.
So How Risky Is Geron?
Statistically speaking companies that lose money are riskier than those that make money. And the fact is that over the last twelve months Geron lost money at the earnings before interest and tax (EBIT) line. And over the same period it saw negative free cash outflow of US$185m and booked a US$201m accounting loss. However, it has net cash of US$360.3m, so it has a bit of time before it will need more capital. Even though its balance sheet seems sufficiently liquid, debt always makes us a little nervous if a company doesn't produce free cash flow regularly. When analysing debt levels, the balance sheet is the obvious place to start. But ultimately, every company can contain risks that exist outside of the balance sheet. Case in point: We've spotted 2 warning signs for Geron you should be aware of, and 1 of them can't be ignored.
Of course, if you're the type of investor who prefers buying stocks without the burden of debt, then don't hesitate to discover our exclusive list of net cash growth stocks, today.
New: Manage All Your Stock Portfolios in One Place
We've created the ultimate portfolio companion for stock investors, and it's free.
• Connect an unlimited number of Portfolios and see your total in one currency
• Be alerted to new Warning Signs or Risks via email or mobile
• Track the Fair Value of your stocks
Have feedback on this article? Concerned about the content? Get in touch with us directly. Alternatively, email editorial-team (at) simplywallst.com.
This article by Simply Wall St is general in nature. We provide commentary based on historical data and analyst forecasts only using an unbiased methodology and our articles are not intended to be financial advice. It does not constitute a recommendation to buy or sell any stock, and does not take account of your objectives, or your financial situation. We aim to bring you long-term focused analysis driven by fundamental data. Note that our analysis may not factor in the latest price-sensitive company announcements or qualitative material. Simply Wall St has no position in any stocks mentioned.
Have feedback on this article? Concerned about the content? Get in touch with us directly. Alternatively, email editorial-team@simplywallst.com
About NasdaqGS:GERN
Geron
A commercial-stage biopharmaceutical company, focuses on the development of therapeutics products for oncology.
Undervalued with high growth potential.
Market Insights

Advertisement
Community Narratives
The Next Phase of Energy Storage: How NeoVolta Is Tackling America’s Power Crunch
Fair Value US$7.50|30.4% undervalued
MA
Community Contributor
A formidable player in AI and enterprise computing.
Fair Value US$210.00|3.0% undervalued
CO
Community Contributor
IREN's Bold Moves in Sustainable Bitcoin Mining & AI Data Centers
Fair Value US$72.52|20.4% undervalued
BL
Community Contributor
Cooling the Champions: The Aussie Tech Behind F1's Victories
Fair Value AU$12.40|38.1% undervalued
TR
Community Contributor