- United States
- /
- Biotech
- /
- NasdaqCM:CAPR
A Look At The Fair Value Of Capricor Therapeutics, Inc. (NASDAQ:CAPR)


Does the November share price for Capricor Therapeutics, Inc. (NASDAQ:CAPR) reflect what it's really worth? Today, we will estimate the stock's intrinsic value by taking the expected future cash flows and discounting them to their present value. This will be done using the Discounted Cash Flow (DCF) model. Don't get put off by the jargon, the math behind it is actually quite straightforward.
Remember though, that there are many ways to estimate a company's value, and a DCF is just one method. If you still have some burning questions about this type of valuation, take a look at the Simply Wall St analysis model.
Check out the opportunities and risks within the US Biotechs industry.
The Method
We're using the 2-stage growth model, which simply means we take in account two stages of company's growth. In the initial period the company may have a higher growth rate and the second stage is usually assumed to have a stable growth rate. To begin with, we have to get estimates of the next ten years of cash flows. Where possible we use analyst estimates, but when these aren't available we extrapolate the previous free cash flow (FCF) from the last estimate or reported value. We assume companies with shrinking free cash flow will slow their rate of shrinkage, and that companies with growing free cash flow will see their growth rate slow, over this period. We do this to reflect that growth tends to slow more in the early years than it does in later years.
Generally we assume that a dollar today is more valuable than a dollar in the future, so we need to discount the sum of these future cash flows to arrive at a present value estimate:
10-year free cash flow (FCF) estimate
| 2023 | 2024 | 2025 | 2026 | 2027 | 2028 | 2029 | 2030 | 2031 | 2032 | |
| Levered FCF ($, Millions) | -US$33.0m | US$31.0m | US$109.0m | US$29.0m | US$7.51m | US$3.66m | US$2.37m | US$1.79m | US$1.50m | US$1.34m |
| Growth Rate Estimate Source | Analyst x1 | Analyst x1 | Analyst x1 | Analyst x1 | Est @ -74.12% | Est @ -51.29% | Est @ -35.31% | Est @ -24.12% | Est @ -16.29% | Est @ -10.81% |
| Present Value ($, Millions) Discounted @ 6.3% | -US$31.0 | US$27.4 | US$90.7 | US$22.7 | US$5.5 | US$2.5 | US$1.5 | US$1.1 | US$0.9 | US$0.7 |
("Est" = FCF growth rate estimated by Simply Wall St)
Present Value of 10-year Cash Flow (PVCF) = US$122m
After calculating the present value of future cash flows in the initial 10-year period, we need to calculate the Terminal Value, which accounts for all future cash flows beyond the first stage. The Gordon Growth formula is used to calculate Terminal Value at a future annual growth rate equal to the 5-year average of the 10-year government bond yield of 2.0%. We discount the terminal cash flows to today's value at a cost of equity of 6.3%.
Terminal Value (TV)= FCF2032 × (1 + g) ÷ (r – g) = US$1.3m× (1 + 2.0%) ÷ (6.3%– 2.0%) = US$31m
Present Value of Terminal Value (PVTV)= TV / (1 + r)10= US$31m÷ ( 1 + 6.3%)10= US$17m
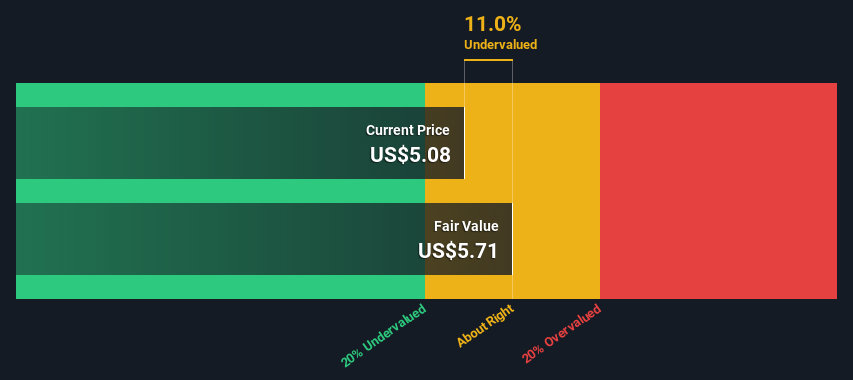
The total value is the sum of cash flows for the next ten years plus the discounted terminal value, which results in the Total Equity Value, which in this case is US$139m. In the final step we divide the equity value by the number of shares outstanding. Relative to the current share price of US$5.1, the company appears about fair value at a 11% discount to where the stock price trades currently. Valuations are imprecise instruments though, rather like a telescope - move a few degrees and end up in a different galaxy. Do keep this in mind.
Important Assumptions
The calculation above is very dependent on two assumptions. The first is the discount rate and the other is the cash flows. You don't have to agree with these inputs, I recommend redoing the calculations yourself and playing with them. The DCF also does not consider the possible cyclicality of an industry, or a company's future capital requirements, so it does not give a full picture of a company's potential performance. Given that we are looking at Capricor Therapeutics as potential shareholders, the cost of equity is used as the discount rate, rather than the cost of capital (or weighted average cost of capital, WACC) which accounts for debt. In this calculation we've used 6.3%, which is based on a levered beta of 0.847. Beta is a measure of a stock's volatility, compared to the market as a whole. We get our beta from the industry average beta of globally comparable companies, with an imposed limit between 0.8 and 2.0, which is a reasonable range for a stable business.
Looking Ahead:
Whilst important, the DCF calculation ideally won't be the sole piece of analysis you scrutinize for a company. DCF models are not the be-all and end-all of investment valuation. Rather it should be seen as a guide to "what assumptions need to be true for this stock to be under/overvalued?" For instance, if the terminal value growth rate is adjusted slightly, it can dramatically alter the overall result. For Capricor Therapeutics, there are three important aspects you should explore:
- Risks: You should be aware of the 2 warning signs for Capricor Therapeutics (1 is a bit concerning!) we've uncovered before considering an investment in the company.
- Future Earnings: How does CAPR's growth rate compare to its peers and the wider market? Dig deeper into the analyst consensus number for the upcoming years by interacting with our free analyst growth expectation chart.
- Other Solid Businesses: Low debt, high returns on equity and good past performance are fundamental to a strong business. Why not explore our interactive list of stocks with solid business fundamentals to see if there are other companies you may not have considered!
PS. The Simply Wall St app conducts a discounted cash flow valuation for every stock on the NASDAQCM every day. If you want to find the calculation for other stocks just search here.
New: AI Stock Screener & Alerts
Our new AI Stock Screener scans the market every day to uncover opportunities.
• Dividend Powerhouses (3%+ Yield)
• Undervalued Small Caps with Insider Buying
• High growth Tech and AI Companies
Or build your own from over 50 metrics.
Have feedback on this article? Concerned about the content? Get in touch with us directly. Alternatively, email editorial-team (at) simplywallst.com.
This article by Simply Wall St is general in nature. We provide commentary based on historical data and analyst forecasts only using an unbiased methodology and our articles are not intended to be financial advice. It does not constitute a recommendation to buy or sell any stock, and does not take account of your objectives, or your financial situation. We aim to bring you long-term focused analysis driven by fundamental data. Note that our analysis may not factor in the latest price-sensitive company announcements or qualitative material. Simply Wall St has no position in any stocks mentioned.
About NasdaqCM:CAPR
Capricor Therapeutics
A clinical-stage biotechnology company, focuses on the development of transformative cell and exosome-based therapeutics for the treatment of duchenne muscular dystrophy (DMD) and other diseases with unmet medical needs.
Flawless balance sheet with high growth potential.
Market Insights

Community Narratives

