
Advertisement
- United States
- /
- Biotech
- /
- NasdaqGM:AUPH
Are Strong Financial Prospects The Force That Is Driving The Momentum In Aurinia Pharmaceuticals Inc.'s NASDAQ:AUPH) Stock?
Most readers would already be aware that Aurinia Pharmaceuticals' (NASDAQ:AUPH) stock increased significantly by 51% over the past three months. Given the company's impressive performance, we decided to study its financial indicators more closely as a company's financial health over the long-term usually dictates market outcomes. In this article, we decided to focus on Aurinia Pharmaceuticals' ROE.
ROE or return on equity is a useful tool to assess how effectively a company can generate returns on the investment it received from its shareholders. In other words, it is a profitability ratio which measures the rate of return on the capital provided by the company's shareholders.
How Is ROE Calculated?
ROE can be calculated by using the formula:
Return on Equity = Net Profit (from continuing operations) ÷ Shareholders' Equity
So, based on the above formula, the ROE for Aurinia Pharmaceuticals is:
18% = US$61m ÷ US$335m (Based on the trailing twelve months to June 2025).
The 'return' refers to a company's earnings over the last year. So, this means that for every $1 of its shareholder's investments, the company generates a profit of $0.18.
View our latest analysis for Aurinia Pharmaceuticals
What Is The Relationship Between ROE And Earnings Growth?
So far, we've learned that ROE is a measure of a company's profitability. Based on how much of its profits the company chooses to reinvest or "retain", we are then able to evaluate a company's future ability to generate profits. Generally speaking, other things being equal, firms with a high return on equity and profit retention, have a higher growth rate than firms that don’t share these attributes.
Aurinia Pharmaceuticals' Earnings Growth And 18% ROE
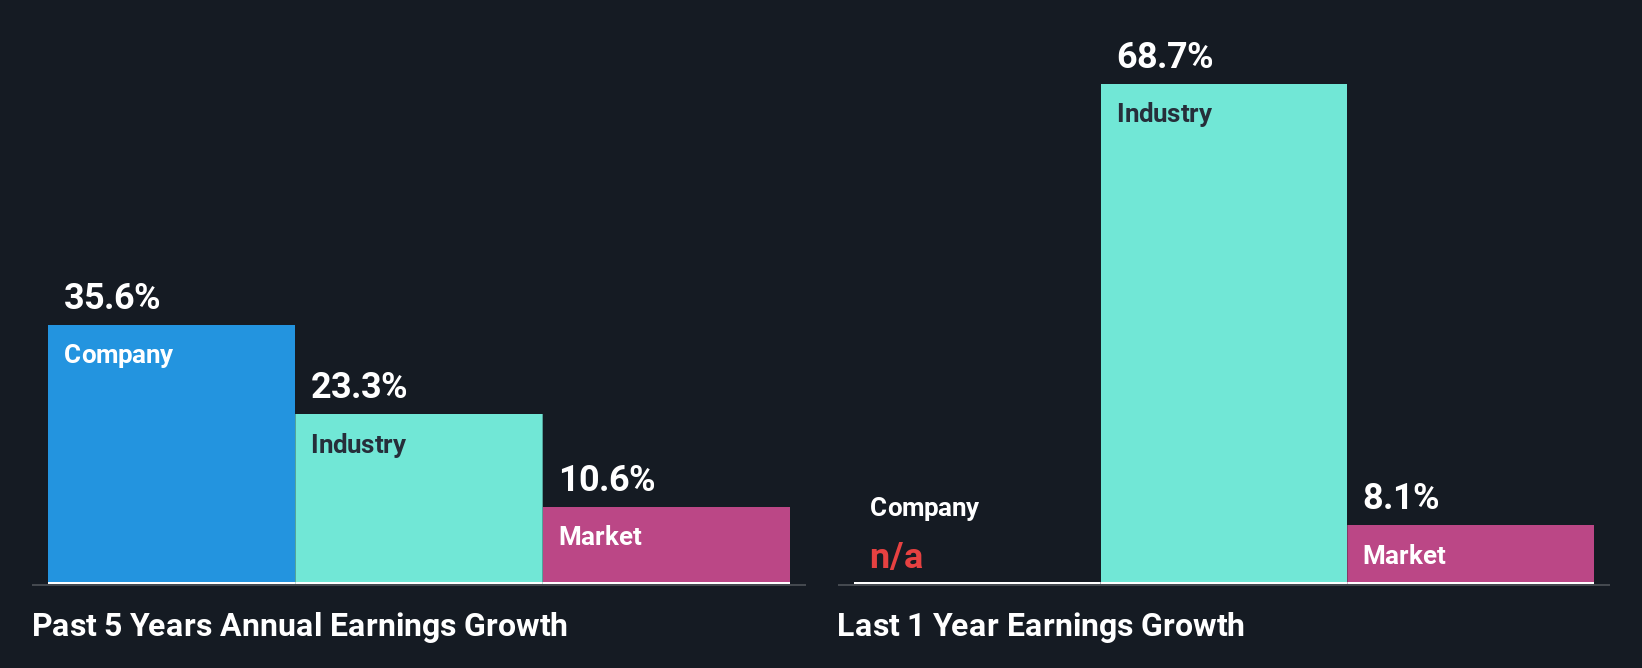
To begin with, Aurinia Pharmaceuticals seems to have a respectable ROE. And on comparing with the industry, we found that the the average industry ROE is similar at 21%. Consequently, this likely laid the ground for the impressive net income growth of 36% seen over the past five years by Aurinia Pharmaceuticals. We reckon that there could also be other factors at play here. For instance, the company has a low payout ratio or is being managed efficiently.
As a next step, we compared Aurinia Pharmaceuticals' net income growth with the industry, and pleasingly, we found that the growth seen by the company is higher than the average industry growth of 23%.
Earnings growth is a huge factor in stock valuation. It’s important for an investor to know whether the market has priced in the company's expected earnings growth (or decline). By doing so, they will have an idea if the stock is headed into clear blue waters or if swampy waters await. One good indicator of expected earnings growth is the P/E ratio which determines the price the market is willing to pay for a stock based on its earnings prospects. So, you may want to check if Aurinia Pharmaceuticals is trading on a high P/E or a low P/E, relative to its industry.
Is Aurinia Pharmaceuticals Making Efficient Use Of Its Profits?
Given that Aurinia Pharmaceuticals doesn't pay any regular dividends to its shareholders, we infer that the company has been reinvesting all of its profits to grow its business.
Conclusion
Overall, we are quite pleased with Aurinia Pharmaceuticals' performance. Particularly, we like that the company is reinvesting heavily into its business, and at a high rate of return. Unsurprisingly, this has led to an impressive earnings growth. With that said, the latest industry analyst forecasts reveal that the company's earnings growth is expected to slow down. To know more about the company's future earnings growth forecasts take a look at this free report on analyst forecasts for the company to find out more.
New: Manage All Your Stock Portfolios in One Place
We've created the ultimate portfolio companion for stock investors, and it's free.
• Connect an unlimited number of Portfolios and see your total in one currency
• Be alerted to new Warning Signs or Risks via email or mobile
• Track the Fair Value of your stocks
Have feedback on this article? Concerned about the content? Get in touch with us directly. Alternatively, email editorial-team (at) simplywallst.com.
This article by Simply Wall St is general in nature. We provide commentary based on historical data and analyst forecasts only using an unbiased methodology and our articles are not intended to be financial advice. It does not constitute a recommendation to buy or sell any stock, and does not take account of your objectives, or your financial situation. We aim to bring you long-term focused analysis driven by fundamental data. Note that our analysis may not factor in the latest price-sensitive company announcements or qualitative material. Simply Wall St has no position in any stocks mentioned.
About NasdaqGM:AUPH
Aurinia Pharmaceuticals
A biopharmaceutical company that engages in delivering therapies to people living with autoimmune diseases with high unmet medical needs.
Flawless balance sheet and fair value.
Similar Companies
Market Insights


Advertisement
Community Narratives
100% Patient Improvement in trial puts this $16M Biotech on the radar
Fair Value US$5.30|72.3% undervalued
JO
Community Contributor
Exxon Mobil's 17.5% Upside Promises Industry-Leading Returns in Energy Transition
Fair Value US$132.00|16.8% undervalued
HE
Community Contributor
NHC Analysis: Quality at a Good Price. A Golden Opportunity?
Fair Value US$179.80|35.5% undervalued
DA
Community Contributor
New Product Lines And Store Expansion Will Fuel Global Momentum
Fair Value US$270.82|37.9% undervalued
AN
Based on Analyst Price Targets