Advertisement
- United States
- /
- Biotech
- /
- NasdaqGS:AMGN
What Does Amgen’s Recent Rally Mean for Its True Value in 2025?

Simply Wall St
Reviewed by Bailey Pemberton
If you are thinking about what to do with Amgen stock right now, you are not alone. Investors have been keeping a close eye on this biotech giant as it’s bounced around in the market, with prices recently closing at $297.32. Over the past week, shares have inched up by 0.9%, but the real story is the last 30 days, where the stock has climbed an impressive 8.4%. Year-to-date, Amgen is up 14.7%, a solid move for a company sometimes viewed as a defensive play in healthcare. But even with that momentum, the stock is still down 4.5% over the last year, making some people wonder if there is more potential left to unlock, or if risks are starting to catch up.
These swings might be influenced by larger market trends and renewed investor confidence in the biotech sector, as well as shifting expectations around drug pipelines and regulatory decisions. For long-term holders, Amgen has shown that patience tends to pay off: up 31.8% over three years and a hefty 51.9% over five years. So, is Amgen undervalued or is it fairly priced after this recent run?
To answer that, we’ll dig into several tried and tested valuation checks. Amgen actually passes 4 out of 6 of them, giving it a value score of 4. In the next section, I’ll walk you through what those valuation checks are, how they matter, and why they don’t always capture the full picture. Stick around, because at the end, we will explore a smarter way to look at valuation that might change how you see the whole company.
Why Amgen is lagging behind its peers
Approach 1: Amgen Discounted Cash Flow (DCF) Analysis
The Discounted Cash Flow (DCF) approach estimates what a company is truly worth by projecting its future free cash flows and then discounting them back to today's dollars. This method tries to answer the big question: if you owned all of Amgen’s future cash generation, what would that be worth in your hands right now?
Amgen is currently generating free cash flow of approximately $10.7 billion. Looking forward, analysts anticipate steady growth, projecting free cash flow to reach $15.1 billion by 2029. For years beyond the analysts' outlook, estimates are extended by Simply Wall St based on reasonable industry assumptions, with projections stretching out over the next decade. All of these cash flows are denominated in US dollars, consistent with Amgen’s reporting.
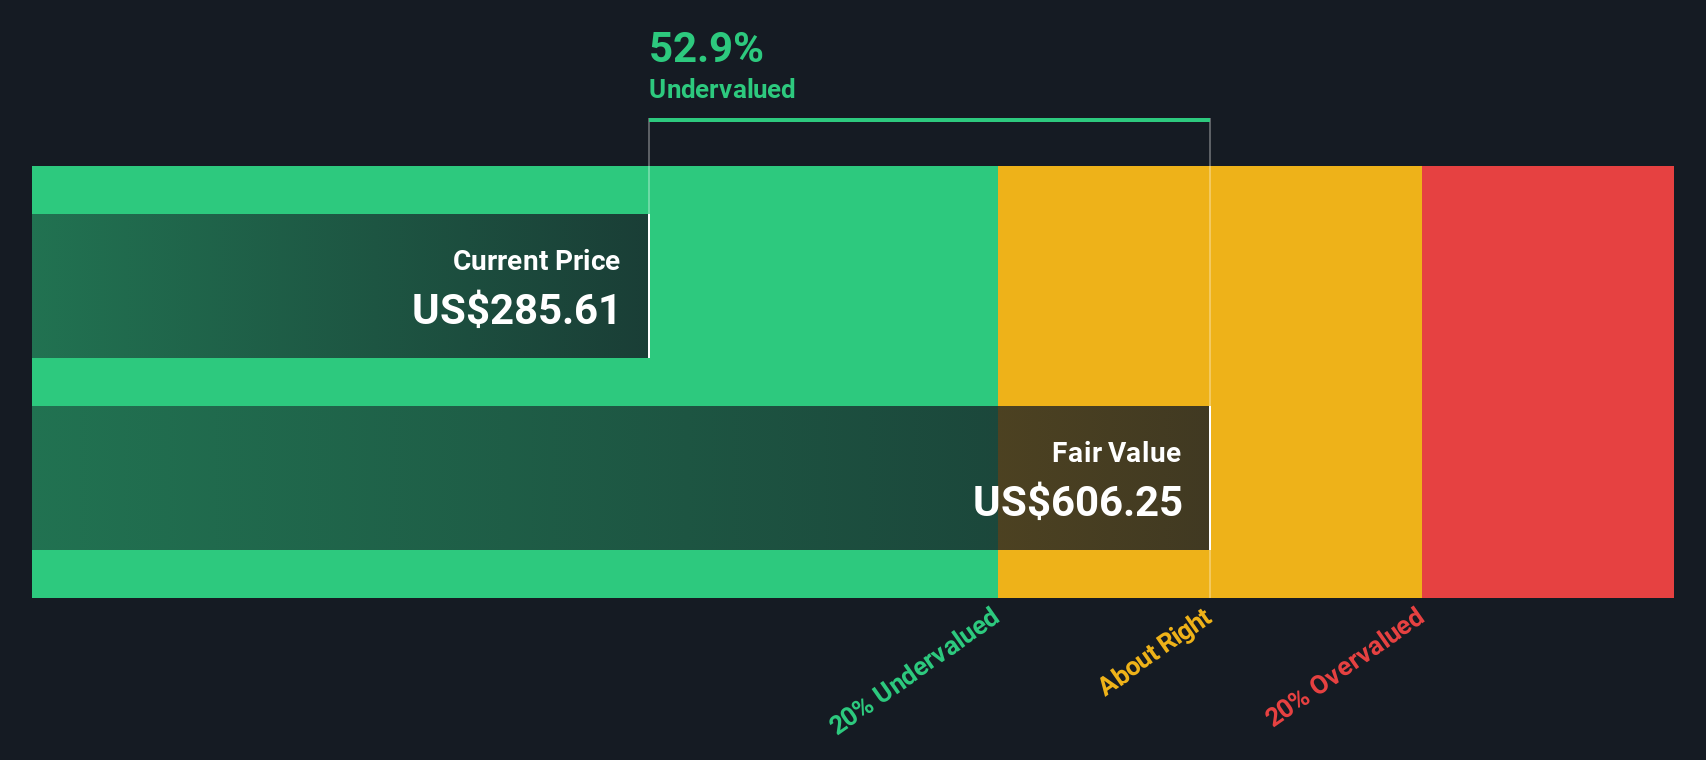
After running these numbers through the DCF model, Amgen’s estimated intrinsic value lands at $581.75 per share, which is almost double the current price of $297.32. This suggests the stock is trading at a 48.9% discount to its fair value, based on today’s cash flow outlook.
Put simply, if the company continues on this path, the shares appear significantly undervalued by the market’s latest assessment.
Result: UNDERVALUED
Our Discounted Cash Flow (DCF) analysis suggests Amgen is undervalued by 48.9%. Track this in your watchlist or portfolio, or discover more undervalued stocks.
Approach 2: Amgen Price vs Earnings (PE Ratio)
The Price-to-Earnings (PE) ratio is often the go-to tool for valuing established, profitable companies like Amgen. Because it relates a company's share price to its earnings, the PE ratio is especially useful when a business has consistent profits and a track record in the market. It gives investors a straightforward snapshot of what they are paying for each dollar of earnings.
However, what counts as a “normal” or “fair” PE ratio can shift quite a bit based on growth prospects and risk. Fast-growing companies typically justify higher PE ratios, while those facing greater uncertainty or slower growth are assigned lower multiples. It is important to weigh these factors instead of just taking the number at face value.
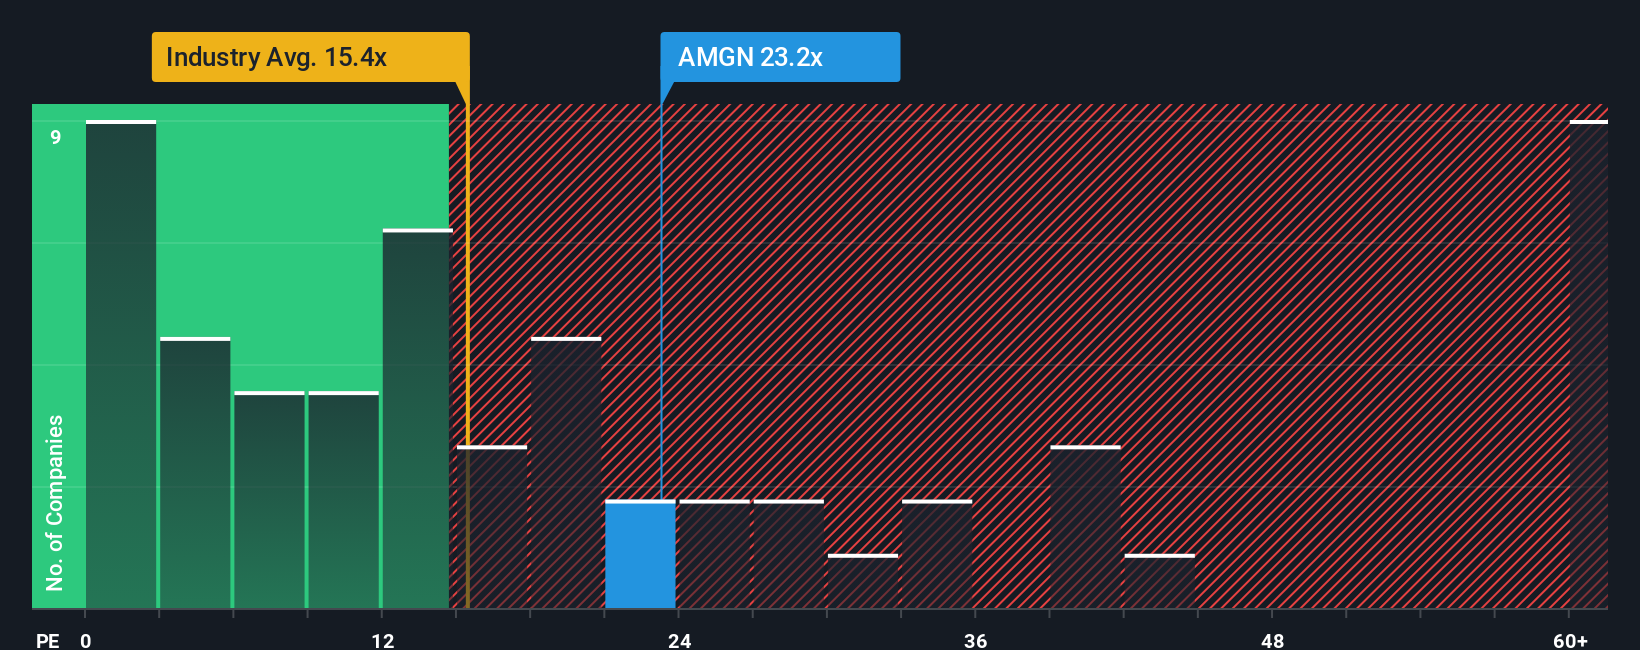
Currently, Amgen trades at a PE of 24.2x, which is above the biotech industry average of 17.2x but well below the peer average of 43.2x. To get a more tailored view, we look at Simply Wall St’s Fair Ratio, which takes into account Amgen’s earnings growth potential, profit margin, size, sector, and risk profile. For Amgen, this Fair Ratio comes in at 25.4x. This nuanced approach is more informative than a simple peer or industry comparison because it reflects Amgen’s specific strengths and risk factors.
When we compare the Fair Ratio of 25.4x to Amgen’s actual PE of 24.2x, the gap is small enough to suggest the valuation is about right, with shares trading close to their fair value based on earnings fundamentals.
Result: ABOUT RIGHT
PE ratios tell one story, but what if the real opportunity lies elsewhere? Discover companies where insiders are betting big on explosive growth.
Upgrade Your Decision Making: Choose your Amgen Narrative
Earlier we mentioned that there is an even better way to understand valuation, so let’s introduce you to Narratives. Narratives are a simple tool that empowers you to give context and perspective to all the numbers you see by setting your own story for a company, your forecast for future revenue, earnings, and profit margins, tied to your personal view of fair value.
Think of a Narrative as the bridge linking Amgen’s business outlook and catalysts to your financial forecast, and ultimately to what you believe the stock is really worth right now. Narratives make sophisticated investing accessible for everyone, and are available to millions of users within Simply Wall St’s Community page, where you can explore and share your own perspective in just a few clicks.
These dynamic stories help you decide what to do next. For example, by comparing the current share price to the Fair Value from your Narrative, you get a clear signal to buy, hold, or sell based on your outlook, not just consensus.
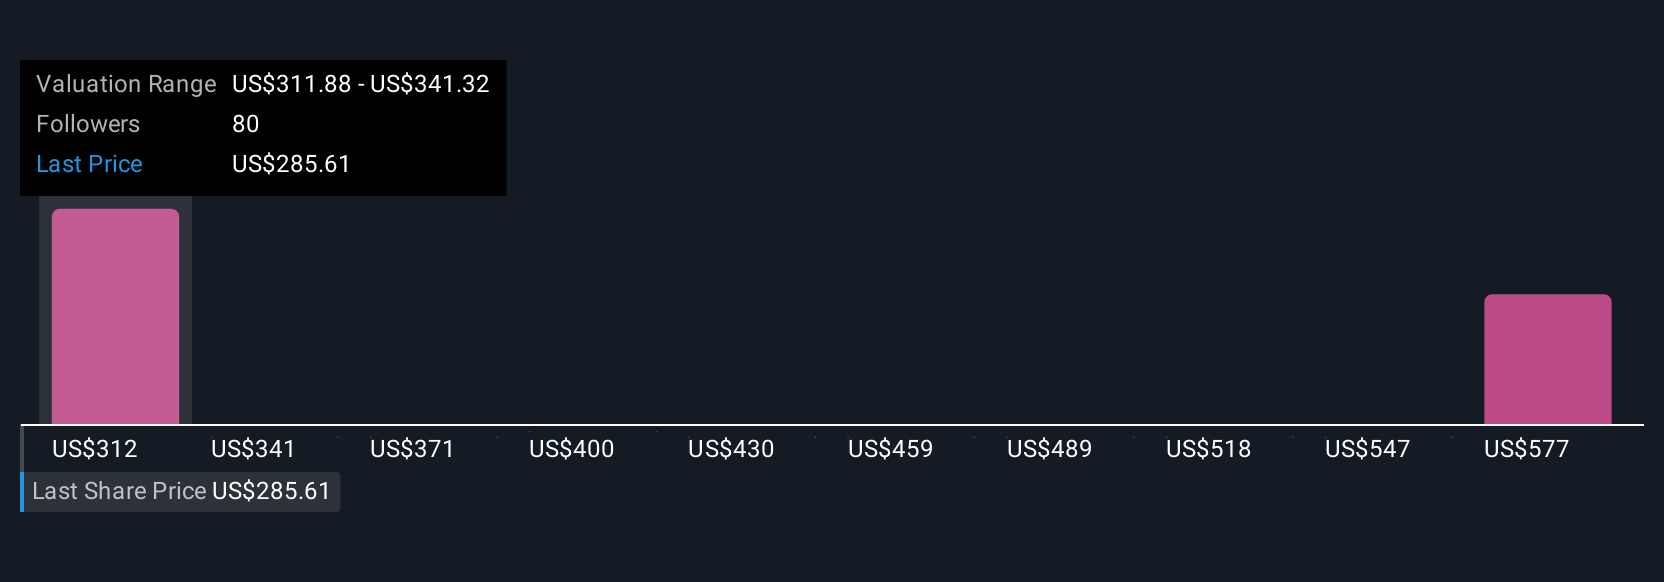
Plus, when there is fresh news or earnings, Narratives immediately update so your view is never out of date. For Amgen, you can see Narratives that are bullish ($405) or cautious ($219), each anchored to different views on future growth, risks, and industry trends. You can find the story that feels most relevant to your own analysis.
For Amgen, we will make it really easy for you with previews of two leading Amgen Narratives:
Fair Value: $404.87
Undervalued by: 26.6%
Forecast Revenue Growth: 7.1%
- AI-driven R&D, recurring product launches, and global market expansion could drive stronger revenue and margin growth than consensus expects.
- Strong resilience to industry pricing pressure and increasing global adoption of biologics and biosimilars enables ongoing growth and improved free cash flow.
- Upside potential from an unlevered balance sheet and strong M&A capacity support above-average, long-term earnings outperformance and access to new chronic care markets.
Fair Value: $218.89
Overvalued by: 35.8%
Forecast Revenue Growth: -0.5%
- Heavy reliance on aging blockbusters and patent expirations makes Amgen's revenue and margins vulnerable to biosimilar and innovative competitors.
- Regulatory and pricing pressures, plus elevated R&D and integration risks, may restrict profitability and put long-term growth at risk.
- Future profitability could be further challenged if acquisitions fail to deliver synergies or new product launches do not fully offset legacy declines.
Do you think there's more to the story for Amgen? Create your own Narrative to let the Community know!
This article by Simply Wall St is general in nature. We provide commentary based on historical data and analyst forecasts only using an unbiased methodology and our articles are not intended to be financial advice. It does not constitute a recommendation to buy or sell any stock, and does not take account of your objectives, or your financial situation. We aim to bring you long-term focused analysis driven by fundamental data. Note that our analysis may not factor in the latest price-sensitive company announcements or qualitative material. Simply Wall St has no position in any stocks mentioned.
New: Manage All Your Stock Portfolios in One Place
We've created the ultimate portfolio companion for stock investors, and it's free.
• Connect an unlimited number of Portfolios and see your total in one currency
• Be alerted to new Warning Signs or Risks via email or mobile
• Track the Fair Value of your stocks
Have feedback on this article? Concerned about the content? Get in touch with us directly. Alternatively, email editorial-team@simplywallst.com
About NasdaqGS:AMGN
Amgen
Amgen Inc. discovers, develops, manufactures, and delivers human therapeutics worldwide.
Established dividend payer and good value.
Similar Companies
Market Insights

Advertisement
Community Narratives
A formidable player in AI and enterprise computing.
Fair Value US$210.00|13.6% overvalued
CO
Community Contributor
IREN's Bold Moves in Sustainable Bitcoin Mining & AI Data Centers
Fair Value US$89.00|23.6% undervalued
BL
Community Contributor
Cooling the Champions: The Aussie Tech Behind F1's Victories
Fair Value AU$12.40|40.6% undervalued
TR
Community Contributor