- United States
- /
- Interactive Media and Services
- /
- NYSE:YALA
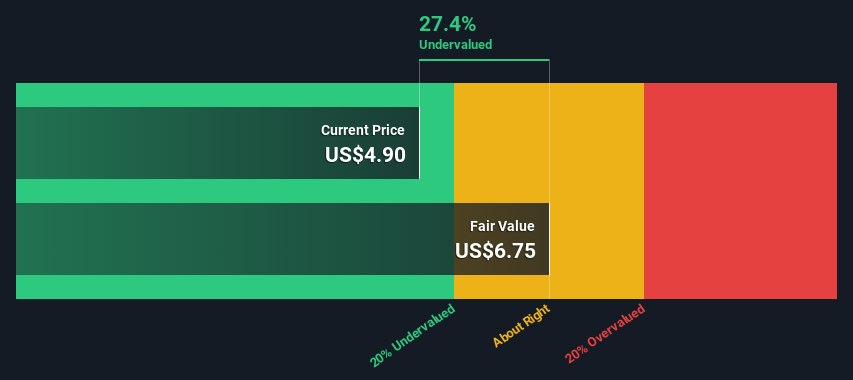
Is Yalla Group Limited (NYSE:YALA) Trading At A 27% Discount?


Key Insights
- The projected fair value for Yalla Group is US$6.75 based on 2 Stage Free Cash Flow to Equity
- Current share price of US$4.90 suggests Yalla Group is potentially 27% undervalued
- Yalla Group's peers seem to be trading at a lower discount to fair value based onthe industry average of 26%
How far off is Yalla Group Limited (NYSE:YALA) from its intrinsic value? Using the most recent financial data, we'll take a look at whether the stock is fairly priced by taking the expected future cash flows and discounting them to today's value. We will use the Discounted Cash Flow (DCF) model on this occasion. It may sound complicated, but actually it is quite simple!
We would caution that there are many ways of valuing a company and, like the DCF, each technique has advantages and disadvantages in certain scenarios. If you still have some burning questions about this type of valuation, take a look at the Simply Wall St analysis model.
Check out our latest analysis for Yalla Group
What's The Estimated Valuation?
We are going to use a two-stage DCF model, which, as the name states, takes into account two stages of growth. The first stage is generally a higher growth period which levels off heading towards the terminal value, captured in the second 'steady growth' period. To start off with, we need to estimate the next ten years of cash flows. Where possible we use analyst estimates, but when these aren't available we extrapolate the previous free cash flow (FCF) from the last estimate or reported value. We assume companies with shrinking free cash flow will slow their rate of shrinkage, and that companies with growing free cash flow will see their growth rate slow, over this period. We do this to reflect that growth tends to slow more in the early years than it does in later years.
A DCF is all about the idea that a dollar in the future is less valuable than a dollar today, so we need to discount the sum of these future cash flows to arrive at a present value estimate:
10-year free cash flow (FCF) estimate
| 2024 | 2025 | 2026 | 2027 | 2028 | 2029 | 2030 | 2031 | 2032 | 2033 | |
| Levered FCF ($, Millions) | US$100.2m | US$91.4m | US$86.3m | US$83.5m | US$82.2m | US$81.7m | US$82.0m | US$82.6m | US$83.6m | US$84.9m |
| Growth Rate Estimate Source | Analyst x1 | Est @ -8.81% | Est @ -5.53% | Est @ -3.24% | Est @ -1.63% | Est @ -0.51% | Est @ 0.28% | Est @ 0.83% | Est @ 1.21% | Est @ 1.48% |
| Present Value ($, Millions) Discounted @ 9.2% | US$91.7 | US$76.6 | US$66.2 | US$58.6 | US$52.8 | US$48.1 | US$44.1 | US$40.7 | US$37.8 | US$35.1 |
("Est" = FCF growth rate estimated by Simply Wall St)
Present Value of 10-year Cash Flow (PVCF) = US$552m
We now need to calculate the Terminal Value, which accounts for all the future cash flows after this ten year period. For a number of reasons a very conservative growth rate is used that cannot exceed that of a country's GDP growth. In this case we have used the 5-year average of the 10-year government bond yield (2.1%) to estimate future growth. In the same way as with the 10-year 'growth' period, we discount future cash flows to today's value, using a cost of equity of 9.2%.
Terminal Value (TV)= FCF2033 × (1 + g) ÷ (r – g) = US$85m× (1 + 2.1%) ÷ (9.2%– 2.1%) = US$1.2b
Present Value of Terminal Value (PVTV)= TV / (1 + r)10= US$1.2b÷ ( 1 + 9.2%)10= US$502m
The total value is the sum of cash flows for the next ten years plus the discounted terminal value, which results in the Total Equity Value, which in this case is US$1.1b. The last step is to then divide the equity value by the number of shares outstanding. Relative to the current share price of US$4.9, the company appears a touch undervalued at a 27% discount to where the stock price trades currently. Valuations are imprecise instruments though, rather like a telescope - move a few degrees and end up in a different galaxy. Do keep this in mind.
The Assumptions
The calculation above is very dependent on two assumptions. The first is the discount rate and the other is the cash flows. Part of investing is coming up with your own evaluation of a company's future performance, so try the calculation yourself and check your own assumptions. The DCF also does not consider the possible cyclicality of an industry, or a company's future capital requirements, so it does not give a full picture of a company's potential performance. Given that we are looking at Yalla Group as potential shareholders, the cost of equity is used as the discount rate, rather than the cost of capital (or weighted average cost of capital, WACC) which accounts for debt. In this calculation we've used 9.2%, which is based on a levered beta of 1.050. Beta is a measure of a stock's volatility, compared to the market as a whole. We get our beta from the industry average beta of globally comparable companies, with an imposed limit between 0.8 and 2.0, which is a reasonable range for a stable business.
SWOT Analysis for Yalla Group
- Earnings growth over the past year exceeded the industry.
- Currently debt free.
- Earnings growth over the past year is below its 5-year average.
- Shareholders have been diluted in the past year.
- Annual earnings are forecast to grow for the next 2 years.
- Good value based on P/E ratio and estimated fair value.
- No apparent threats visible for YALA.
Moving On:
Although the valuation of a company is important, it is only one of many factors that you need to assess for a company. It's not possible to obtain a foolproof valuation with a DCF model. Rather it should be seen as a guide to "what assumptions need to be true for this stock to be under/overvalued?" For instance, if the terminal value growth rate is adjusted slightly, it can dramatically alter the overall result. Can we work out why the company is trading at a discount to intrinsic value? For Yalla Group, there are three relevant elements you should further research:
- Risks: As an example, we've found 1 warning sign for Yalla Group that you need to consider before investing here.
- Future Earnings: How does YALA's growth rate compare to its peers and the wider market? Dig deeper into the analyst consensus number for the upcoming years by interacting with our free analyst growth expectation chart.
- Other Solid Businesses: Low debt, high returns on equity and good past performance are fundamental to a strong business. Why not explore our interactive list of stocks with solid business fundamentals to see if there are other companies you may not have considered!
PS. Simply Wall St updates its DCF calculation for every American stock every day, so if you want to find the intrinsic value of any other stock just search here.
New: Manage All Your Stock Portfolios in One Place
We've created the ultimate portfolio companion for stock investors, and it's free.
• Connect an unlimited number of Portfolios and see your total in one currency
• Be alerted to new Warning Signs or Risks via email or mobile
• Track the Fair Value of your stocks
Have feedback on this article? Concerned about the content? Get in touch with us directly. Alternatively, email editorial-team (at) simplywallst.com.
This article by Simply Wall St is general in nature. We provide commentary based on historical data and analyst forecasts only using an unbiased methodology and our articles are not intended to be financial advice. It does not constitute a recommendation to buy or sell any stock, and does not take account of your objectives, or your financial situation. We aim to bring you long-term focused analysis driven by fundamental data. Note that our analysis may not factor in the latest price-sensitive company announcements or qualitative material. Simply Wall St has no position in any stocks mentioned.
About NYSE:YALA
Yalla Group
Operates a social networking and gaming platform primarily in the Middle East and North Africa region.
Flawless balance sheet and undervalued.
Market Insights

Community Narratives
