
Advertisement
- United States
- /
- Entertainment
- /
- NasdaqGS:WMG
Warner Music Group Corp. (NASDAQ:WMG) Shares Could Be 23% Below Their Intrinsic Value Estimate

Key Insights
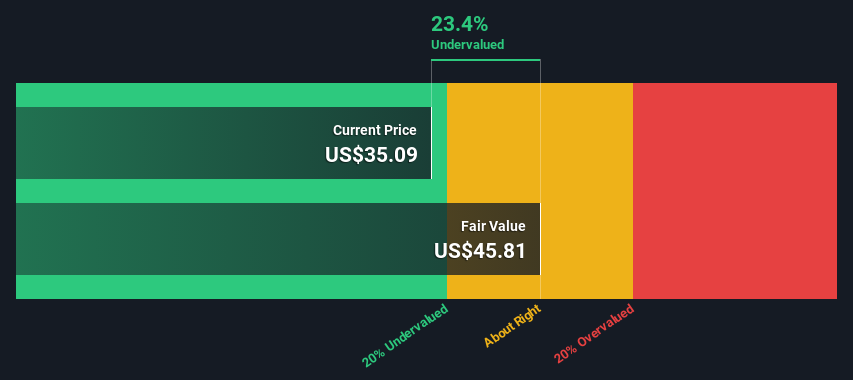
- Warner Music Group's estimated fair value is US$45.81 based on 2 Stage Free Cash Flow to Equity
- Warner Music Group's US$35.09 share price signals that it might be 23% undervalued
- Analyst price target for WMG is US$39.44 which is 14% below our fair value estimate
Today we'll do a simple run through of a valuation method used to estimate the attractiveness of Warner Music Group Corp. (NASDAQ:WMG) as an investment opportunity by estimating the company's future cash flows and discounting them to their present value. We will take advantage of the Discounted Cash Flow (DCF) model for this purpose. There's really not all that much to it, even though it might appear quite complex.
Companies can be valued in a lot of ways, so we would point out that a DCF is not perfect for every situation. If you still have some burning questions about this type of valuation, take a look at the Simply Wall St analysis model.
View our latest analysis for Warner Music Group
The Model
We are going to use a two-stage DCF model, which, as the name states, takes into account two stages of growth. The first stage is generally a higher growth period which levels off heading towards the terminal value, captured in the second 'steady growth' period. To begin with, we have to get estimates of the next ten years of cash flows. Where possible we use analyst estimates, but when these aren't available we extrapolate the previous free cash flow (FCF) from the last estimate or reported value. We assume companies with shrinking free cash flow will slow their rate of shrinkage, and that companies with growing free cash flow will see their growth rate slow, over this period. We do this to reflect that growth tends to slow more in the early years than it does in later years.
A DCF is all about the idea that a dollar in the future is less valuable than a dollar today, so we need to discount the sum of these future cash flows to arrive at a present value estimate:
10-year free cash flow (FCF) estimate
| 2024 | 2025 | 2026 | 2027 | 2028 | 2029 | 2030 | 2031 | 2032 | 2033 | |
| Levered FCF ($, Millions) | US$777.5m | US$838.7m | US$967.5m | US$1.00b | US$1.28b | US$1.41b | US$1.51b | US$1.61b | US$1.69b | US$1.76b |
| Growth Rate Estimate Source | Analyst x7 | Analyst x8 | Analyst x7 | Analyst x3 | Analyst x1 | Est @ 9.99% | Est @ 7.71% | Est @ 6.11% | Est @ 4.99% | Est @ 4.21% |
| Present Value ($, Millions) Discounted @ 7.8% | US$721 | US$721 | US$772 | US$743 | US$877 | US$894 | US$893 | US$879 | US$856 | US$827 |
("Est" = FCF growth rate estimated by Simply Wall St)
Present Value of 10-year Cash Flow (PVCF) = US$8.2b
After calculating the present value of future cash flows in the initial 10-year period, we need to calculate the Terminal Value, which accounts for all future cash flows beyond the first stage. For a number of reasons a very conservative growth rate is used that cannot exceed that of a country's GDP growth. In this case we have used the 5-year average of the 10-year government bond yield (2.4%) to estimate future growth. In the same way as with the 10-year 'growth' period, we discount future cash flows to today's value, using a cost of equity of 7.8%.
Terminal Value (TV)= FCF2033 × (1 + g) ÷ (r – g) = US$1.8b× (1 + 2.4%) ÷ (7.8%– 2.4%) = US$33b
Present Value of Terminal Value (PVTV)= TV / (1 + r)10= US$33b÷ ( 1 + 7.8%)10= US$16b
The total value, or equity value, is then the sum of the present value of the future cash flows, which in this case is US$24b. To get the intrinsic value per share, we divide this by the total number of shares outstanding. Compared to the current share price of US$35.1, the company appears a touch undervalued at a 23% discount to where the stock price trades currently. Remember though, that this is just an approximate valuation, and like any complex formula - garbage in, garbage out.
The Assumptions
Now the most important inputs to a discounted cash flow are the discount rate, and of course, the actual cash flows. If you don't agree with these result, have a go at the calculation yourself and play with the assumptions. The DCF also does not consider the possible cyclicality of an industry, or a company's future capital requirements, so it does not give a full picture of a company's potential performance. Given that we are looking at Warner Music Group as potential shareholders, the cost of equity is used as the discount rate, rather than the cost of capital (or weighted average cost of capital, WACC) which accounts for debt. In this calculation we've used 7.8%, which is based on a levered beta of 1.185. Beta is a measure of a stock's volatility, compared to the market as a whole. We get our beta from the industry average beta of globally comparable companies, with an imposed limit between 0.8 and 2.0, which is a reasonable range for a stable business.
SWOT Analysis for Warner Music Group
Strength
- Debt is well covered by earnings.
- Dividends are covered by earnings and cash flows.
Weakness
- Earnings declined over the past year.
- Dividend is low compared to the top 25% of dividend payers in the Entertainment market.
Opportunity
- Annual earnings are forecast to grow faster than the American market.
- Trading below our estimate of fair value by more than 20%.
Threat
- Debt is not well covered by operating cash flow.
- Annual revenue is forecast to grow slower than the American market.
Next Steps:
Valuation is only one side of the coin in terms of building your investment thesis, and it ideally won't be the sole piece of analysis you scrutinize for a company. The DCF model is not a perfect stock valuation tool. Instead the best use for a DCF model is to test certain assumptions and theories to see if they would lead to the company being undervalued or overvalued. For instance, if the terminal value growth rate is adjusted slightly, it can dramatically alter the overall result. Why is the intrinsic value higher than the current share price? For Warner Music Group, we've compiled three fundamental factors you should look at:
- Risks: As an example, we've found 3 warning signs for Warner Music Group (1 doesn't sit too well with us!) that you need to consider before investing here.
- Future Earnings: How does WMG's growth rate compare to its peers and the wider market? Dig deeper into the analyst consensus number for the upcoming years by interacting with our free analyst growth expectation chart.
- Other Solid Businesses: Low debt, high returns on equity and good past performance are fundamental to a strong business. Why not explore our interactive list of stocks with solid business fundamentals to see if there are other companies you may not have considered!
PS. The Simply Wall St app conducts a discounted cash flow valuation for every stock on the NASDAQGS every day. If you want to find the calculation for other stocks just search here.
Valuation is complex, but we're here to simplify it.
Discover if Warner Music Group might be undervalued or overvalued with our detailed analysis, featuring fair value estimates, potential risks, dividends, insider trades, and its financial condition.
Access Free AnalysisHave feedback on this article? Concerned about the content? Get in touch with us directly. Alternatively, email editorial-team (at) simplywallst.com.
This article by Simply Wall St is general in nature. We provide commentary based on historical data and analyst forecasts only using an unbiased methodology and our articles are not intended to be financial advice. It does not constitute a recommendation to buy or sell any stock, and does not take account of your objectives, or your financial situation. We aim to bring you long-term focused analysis driven by fundamental data. Note that our analysis may not factor in the latest price-sensitive company announcements or qualitative material. Simply Wall St has no position in any stocks mentioned.
About NasdaqGS:WMG
Warner Music Group
Operates as a music entertainment company in the United States, the United Kingdom, Germany, and internationally.
Fair value with moderate growth potential.
Market Insights

Advertisement
Community Narratives
Pinterest will surge as advertising innovations ignite revenue growth
Fair Value US$42.63|27.1% undervalued
BR
Community Contributor
Brambles' Revenue Set to Climb 14% with Profit Margins Following
Fair Value AU$21.90|4.9% overvalued
RO
Community Contributor
Challenging Future for STG as Organic Sales Decline by 8.8%
Fair Value DKK 116.13|26.8% undervalued
KA
Community Contributor