Advertisement
- United States
- /
- Media
- /
- NasdaqGS:SBGI
What Sinclair’s Jimmy Kimmel U-Turn Means for Investors Amid 65% Valuation Gap

Simply Wall St
Reviewed by Bailey Pemberton
Thinking about what to do with Sinclair stock? You are not alone. Whether you already own shares or are considering jumping in, there is a lot to unpack right now. The stock closed at $14.51 recently, and while the numbers show a 4.8% gain over the past month, the year-to-date return is still down 14.6%. These swings have some investors on edge, while others are just curious about where the real value and risk might be hiding.
Part of the recent movement can be traced to Sinclair’s headline-grabbing decisions around "Jimmy Kimmel Live!" Stations first preempted the show, but now the company is putting it back on air. If you are wondering how such programming shake-ups influence market sentiment, you are not off base. When major affiliates shift schedules, it can influence how investors perceive both the company’s growth potential and its risk profile.
If you zoom out, Sinclair’s long-term performance is mixed. The stock is down 6.1% over the past year and nearly flat over five years. In short, this is a company with both headwinds and intriguing storylines. It is no surprise that big merger discussions are in the background as well.
From a valuation perspective, Sinclair earns a score of 2 out of 6 on our value checklist, signaling it is undervalued by a couple of key measures but not a screaming bargain. But how did we get to that number? Let’s take a closer look at the different valuation approaches and stay tuned, because there might be an even smarter way to size up Sinclair’s true worth.
Sinclair scores just 2/6 on our valuation checks. See what other red flags we found in the full valuation breakdown.
Approach 1: Sinclair Discounted Cash Flow (DCF) Analysis
The Discounted Cash Flow (DCF) model works by projecting Sinclair’s future cash flows and then discounting them back to today’s value. This offers an informed estimate of what the company is fundamentally worth. With this approach, the focus is on actual cash generated by the business, rather than just earnings or book value.
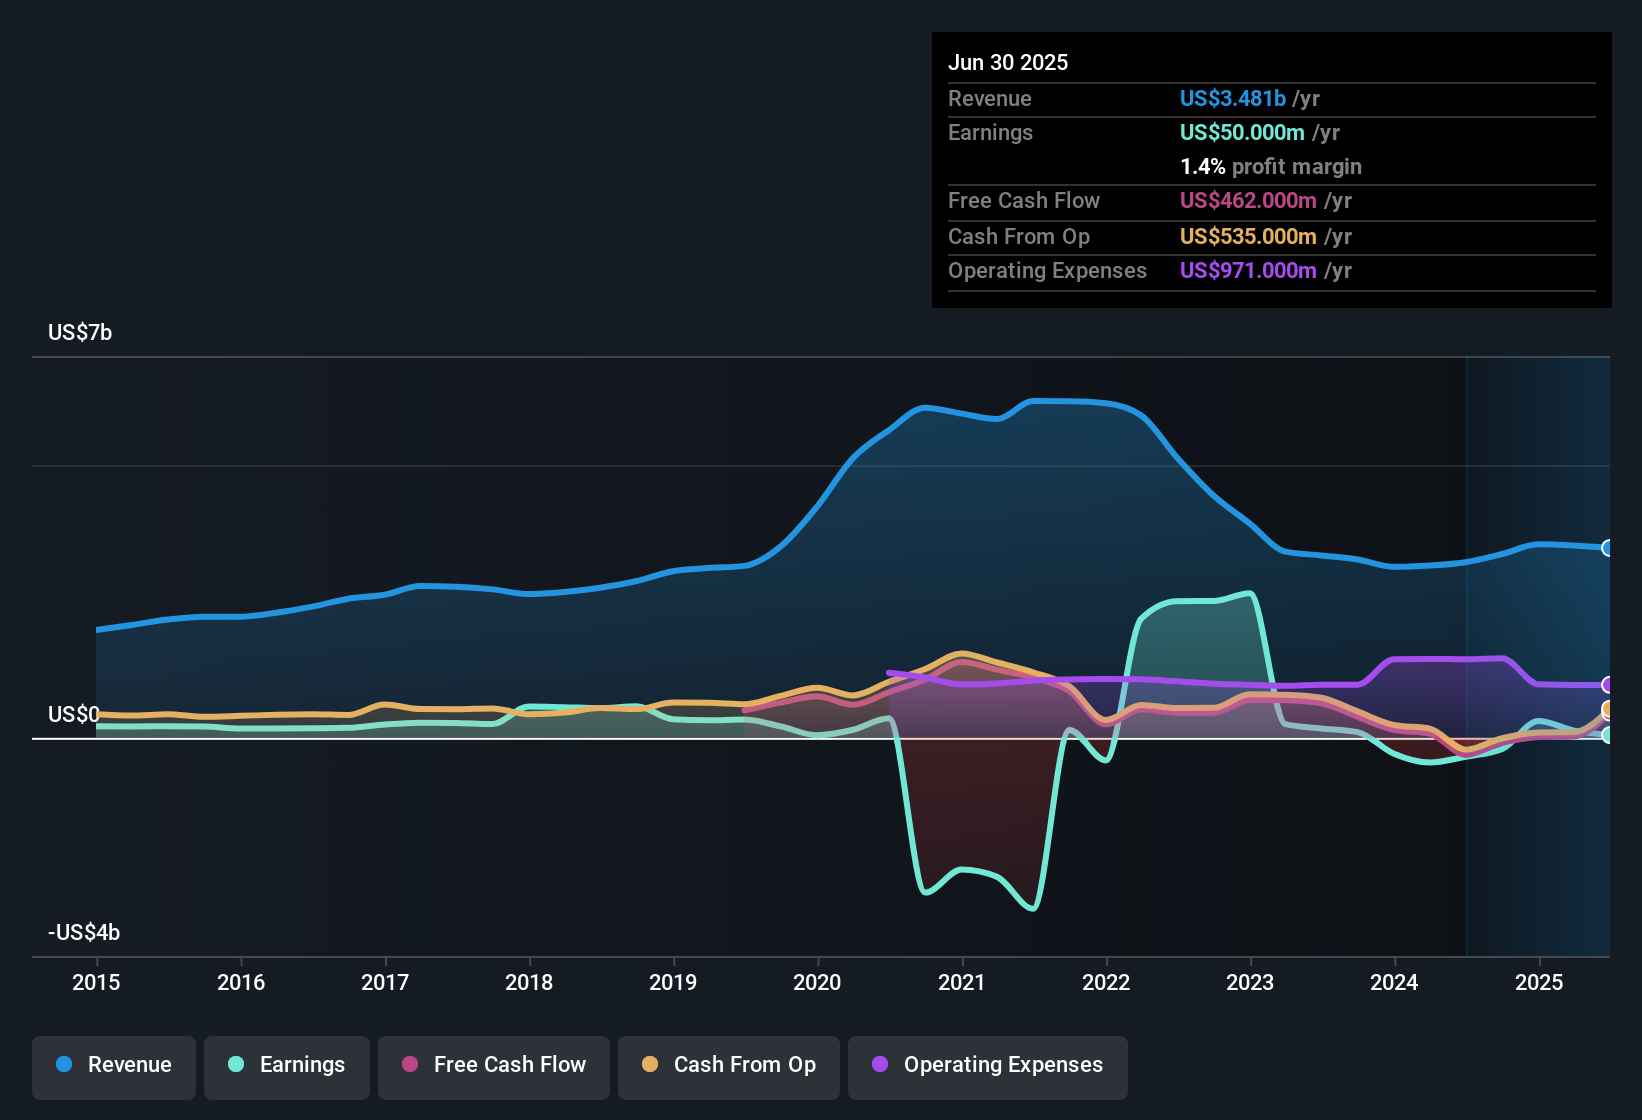
Sinclair’s current Free Cash Flow (FCF) stands at $441.8 million. According to analyst estimates, FCF is expected to fall steadily over the next decade. For example, by 2026, FCF is projected to be $292.3 million, dropping to $79.6 million by 2027. After that, extrapolated estimates show continued declines, with FCF expected to fall to approximately $35.5 million by 2035. These projections, while helpful, become less reliable the further out they go. This is especially true since analyst forecasts typically only extend five years and the rest is estimated based on trends.
According to this DCF approach, the intrinsic value of Sinclair’s stock comes out to $8.80 per share. That is a steep discount compared to the current share price of $14.51, a gap of roughly 64.9%. In short, the DCF analysis suggests Sinclair’s shares are significantly overvalued at today’s price.
Result: OVERVALUED
Our Discounted Cash Flow (DCF) analysis suggests Sinclair may be overvalued by 64.9%. Find undervalued stocks or create your own screener to find better value opportunities.
Approach 2: Sinclair Price vs Earnings
The price-to-earnings (PE) ratio is a widely used valuation metric, especially for profitable companies like Sinclair. It gives potential investors a quick sense of how much they are paying for each dollar of earnings, which is particularly relevant when a company reliably generates profits. This ratio is a go-to method because it directly ties the company’s share price to its actual bottom-line performance.
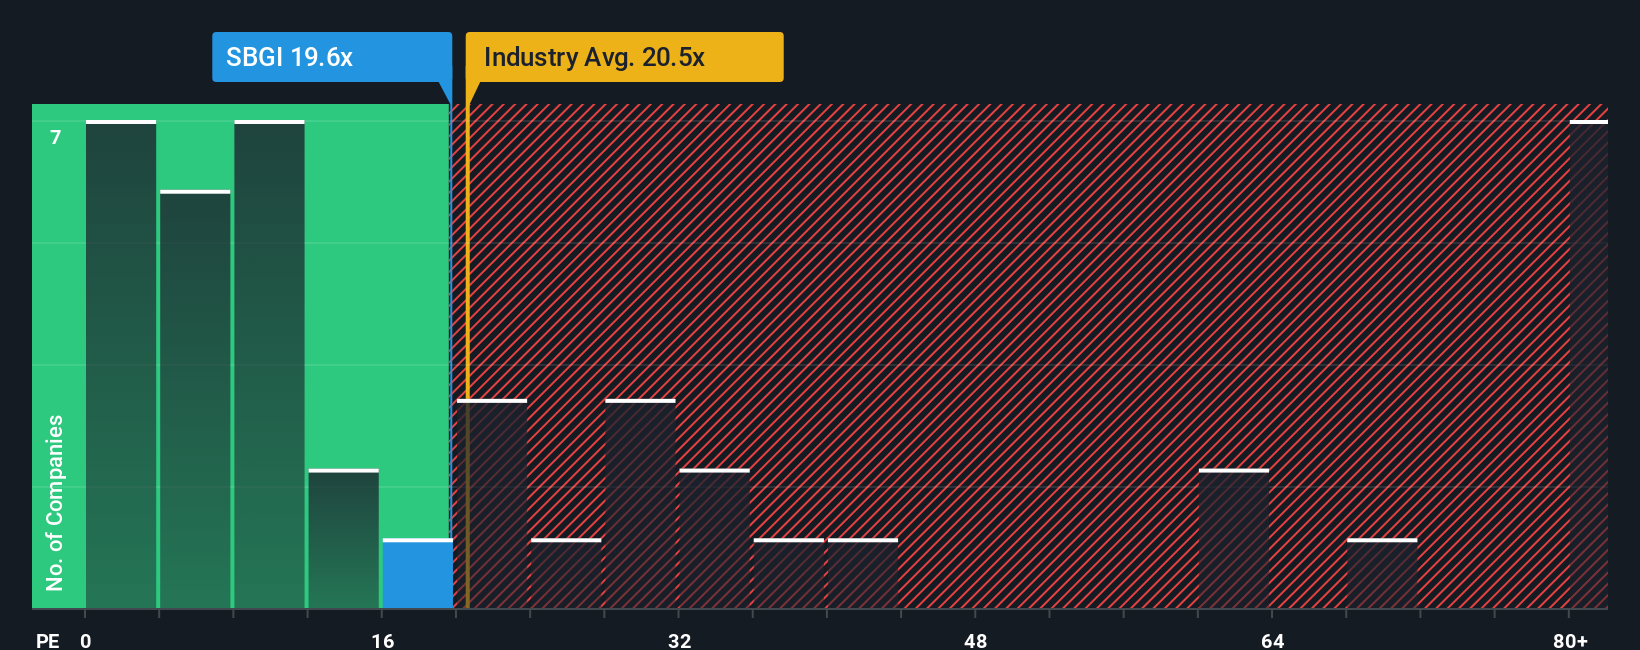
What counts as a "fair" PE ratio can vary. Higher ratios are usually warranted for companies expected to grow quickly or those with lower risk profiles, while slower-growing or riskier companies typically deserve lower ratios. Benchmarks help put things in perspective: Sinclair currently trades at a PE ratio of 20.2x. This is just under the industry average of 20.8x for the media sector, but well above the average PE of its peers, which sits at 6.5x. Clearly, the market is pricing Sinclair’s earnings at a similar level to the wider industry, but noticeably higher than its closest competitors.
Rather than just comparing Sinclair against industry peers, Simply Wall St uses a proprietary “Fair Ratio” to capture a fuller picture. The Fair Ratio factors in more than just sector averages, folding in Sinclair’s actual earnings growth, risk profile, profit margins, market size and other important variables. For Sinclair, the Fair Ratio is 20.7x. This is almost identical to its current PE ratio of 20.2x, suggesting the market valuation is in line with what an informed investor might expect based on the company’s fundamentals.
Result: ABOUT RIGHT
PE ratios tell one story, but what if the real opportunity lies elsewhere? Discover companies where insiders are betting big on explosive growth.
Upgrade Your Decision Making: Choose your Sinclair Narrative
Earlier we mentioned that there is an even better way to understand valuation, so let’s introduce you to Narratives. A Narrative is a simple way for investors to lay out their own story or perspective on a company, connecting what they believe about Sinclair’s business and future with transparent, personalized estimates for things like future revenue, profits, and margins.
This approach ties a company’s underlying story directly to a financial forecast and a calculated fair value. It helps you move beyond static models and see the bigger picture. Narratives are easy to create and explore right within the Community page on Simply Wall St, which is already used by millions of investors.
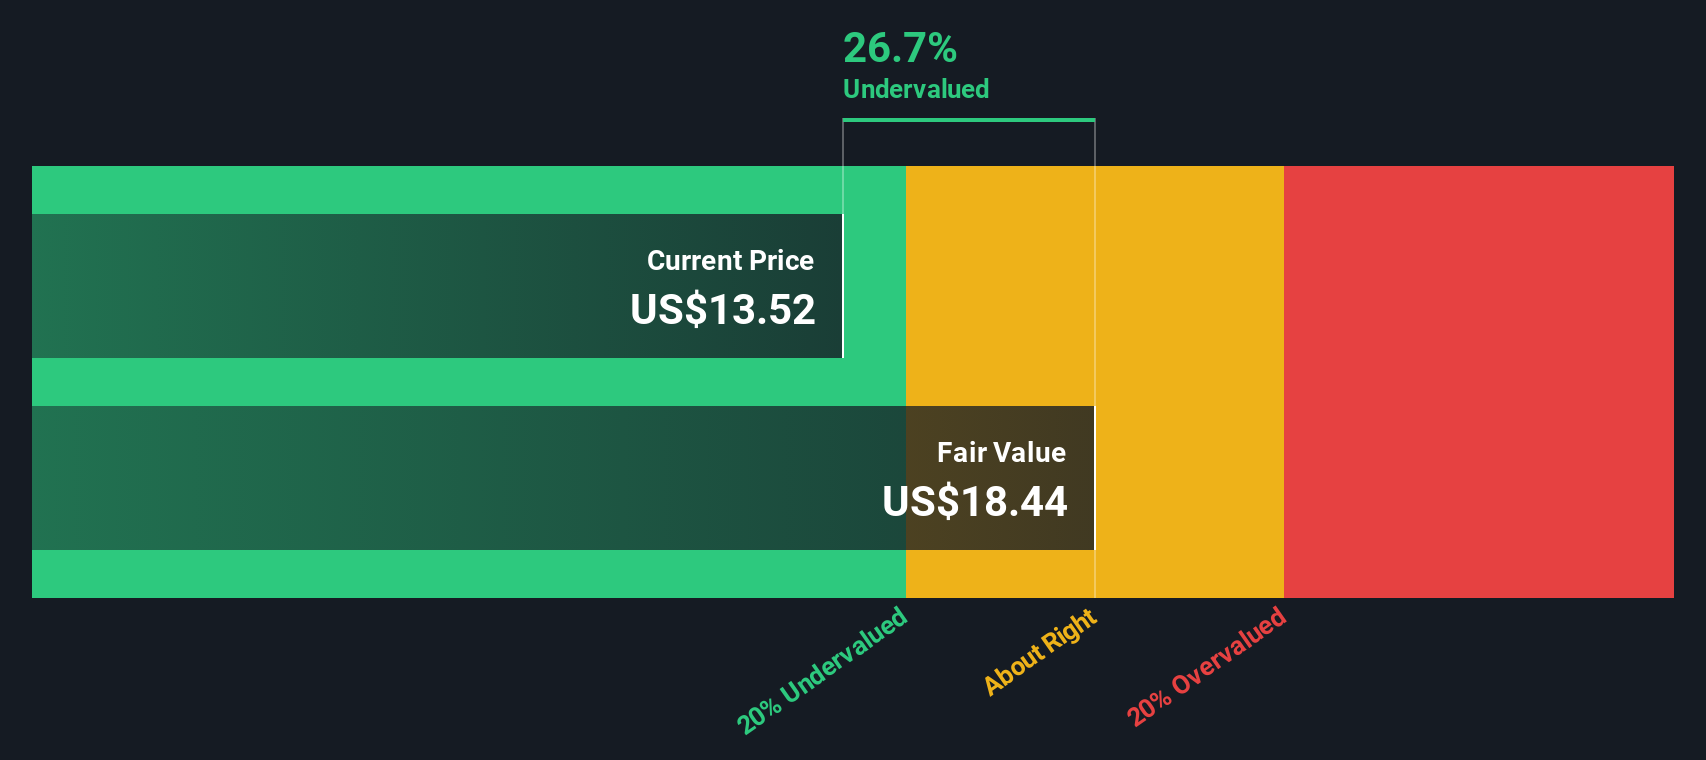
They allow you to compare your own fair value with the current market price, making it clearer when it might be favorable to buy or sell, and are dynamically updated as new earnings or news arrives. For example, some investors might be optimistic about Sinclair’s new digital initiatives and forecast a fair value as high as $27.00 per share. Others may focus on TV headwinds and set it closer to $8.50, all using the same platform.
Do you think there's more to the story for Sinclair? Create your own Narrative to let the Community know!
This article by Simply Wall St is general in nature. We provide commentary based on historical data and analyst forecasts only using an unbiased methodology and our articles are not intended to be financial advice. It does not constitute a recommendation to buy or sell any stock, and does not take account of your objectives, or your financial situation. We aim to bring you long-term focused analysis driven by fundamental data. Note that our analysis may not factor in the latest price-sensitive company announcements or qualitative material. Simply Wall St has no position in any stocks mentioned.
New: Manage All Your Stock Portfolios in One Place
We've created the ultimate portfolio companion for stock investors, and it's free.
• Connect an unlimited number of Portfolios and see your total in one currency
• Be alerted to new Warning Signs or Risks via email or mobile
• Track the Fair Value of your stocks
Have feedback on this article? Concerned about the content? Get in touch with us directly. Alternatively, email editorial-team@simplywallst.com
About NasdaqGS:SBGI
Sinclair
A media company, provides content on local television stations and digital platforms in the United States.
Established dividend payer with moderate growth potential.
Similar Companies
Market Insights

Advertisement
Community Narratives
A formidable player in AI and enterprise computing.
Fair Value US$210.00|3.1% overvalued
CO
Community Contributor
IREN's Bold Moves in Sustainable Bitcoin Mining & AI Data Centers
Fair Value US$72.52|11.6% undervalued
BL
Community Contributor
Cooling the Champions: The Aussie Tech Behind F1's Victories
Fair Value AU$12.40|40.4% undervalued
TR
Community Contributor