Advertisement
- United States
- /
- Interactive Media and Services
- /
- NasdaqGS:META
Even After a Slump in Expected Earnings, Meta Platforms (NASDAQ:META) may Still be Cheap Relative to Industry Peers
Summary:
- Trading at a historically low PE, as well as below the median industry average
- While price targets indicate upside, they also have a larger spread, indicating more risk
- Income metrics are expected to slump, but the market seems to have oversold future earnings
Meta Platforms, Inc. (NASDAQ:META) finally changed its ticker as part of the final transformation step to a company dedicated to the development of the metaverse. While it is exciting to see how the virtual reality project pans out, today, we will focus on the money making capacity of Meta.
It seems that the company has some attractive cash flows for investors, but with all the media attention in recent months, investors may have tuned out until the dust settles. This is why, now is a great time to review how much money is Meta projected to make and what that means for the share price.
We start off with analysts' estimates for future earnings, as they can give us a better understanding of what the company is expected to make in the future. As investors, we may not want to rely on past performance since things may change, and we'd want to have a preview of what to expect.
Future Estimates for Meta
In the chart below, we can see the average estimates for Meta's income for the next 3 years:
See our latest analysis for Meta Platforms
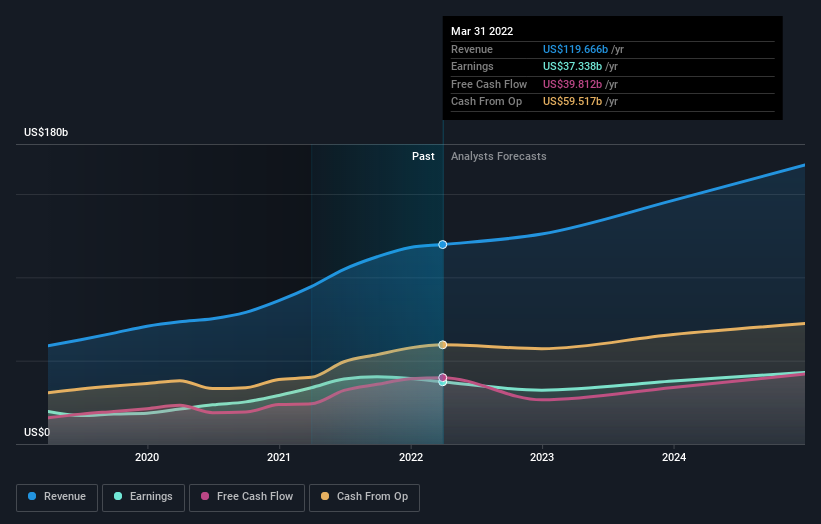
It seems that the 50 analysts covering Meta are estimating revenues of $125.9b in 2022, which would reflect a 5.2% growth from the last 12 months. This is great, indicating that even amongst the internal shifts in Meta, the company is still expected to grow. Further, Analysts are expecting the company to reach revenues of $167.4b by 2025. This shows that while growth may have somewhat slumped, the company still has a lot of room to optimize the core business.
Considering the bottom line, analysts expect that Meta will make a net income of about $32.3b by 2023, which means a 13.6% decline. The free cash flows are expected to come down even lower to $26.5b as Meta is increasing the capital spending for the Metaverse project. The 33.4% expected drop in the free cash flows, is a major point of concern for investors, and we will examine what that may imply for the pricing of the stock.
Meta's Pricing Analysis
We will look at three indicators of pricing for Meta: price targets, price to earnings, and the forward price to earnings. Together, these indicators will help us form a more complete picture for Meta, as opposed to looking at an individual indicator.
Price Target
The average price target for Meta remains unchanged at $282 per share, indicating a 65% upside from the last close price of $170. It is important to note that this is an average estimate from multiple analysts, and looking at the range of estimates may yield a more realistic picture of expectations.
The lower bound estimate is for a price target of $180 per share, while the upper bound - e.g. the most bullish estimate is for $466 per share. Clearly, there is a lot of disagreement between analysts regarding the future price of Meta, and a spread like this may be more indicative of the higher level of risk in the stock, rather than a clear forecast for future price levels.
Price to Earnings
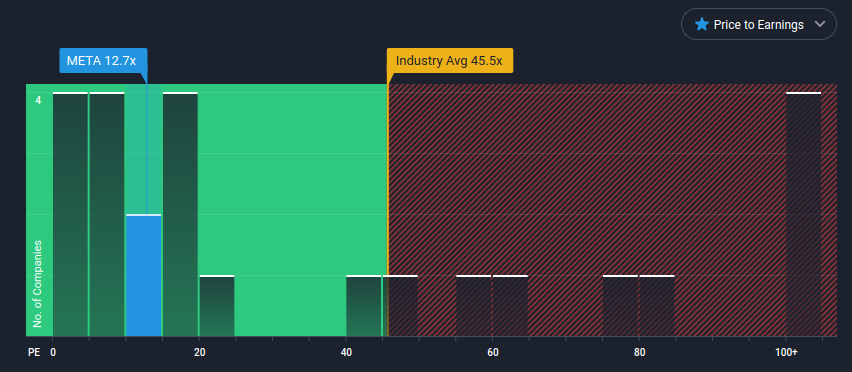
When we want to know how much investors are paying for the underlying fundamentals of a stock - in this case the earnings, we can look at the most used ratio, known as the price to earnings ratio. For Meta, the trailing 12-month PE is 12.7x, reaching historical lows for the company. This means that investors are paying 12.7 dollars for every 1 dollar of earnings - conversely, it means that investors should expect to return their investment in 12.7 years. These are just ways to better understand what a price to earnings ratio means for a stock, and are not representative of any guarantees for upside or a return on investment.
We can use the PE ratio in comparison to other stocks in the industry and see how Meta is being priced amongst a group of peers. In the chart below, we can see that relative to the industry, Meta is being priced cheaper than the median stock.
Forward Price to Earnings
By utilizing analysts' forecasts for next year's earnings, we can create a forward-looking PE ratio, which tells us how the current price reflects future earnings. Since the value of a stock is in the future, as opposed to historical performance, this ratio gives us a better estimate of the price premium/discount for the stock.
The forward PE for Meta comes up to 14x. While this is a slight increase over the current 12.7x, the stock is still relatively cheap, both compared to industry peers, and its own historical levels.
A low PE ratio, may not represent an immediate signal to buy, as we first need to make sure that we know "why" the stock is trading cheaply and make our own estimates whether this is a temporary situation or if there is an underlying problem at the company that is likely to persist. Investors that view the company recovering and maintaining high earnings, will be inclined to view Meta as a cheap stock, while investors that hold a view that the company is in a business and litigation downward spiral will be more cautious and inclined to wait before making a decision.
The Bottom Line
The price target, trailing and forward PE ratio indicate that there is significant upside in Meta. However, the company is also more risky as reflected by the spread of price target estimates, as well as the increasing number of litigation items, an estimated decline in earnings and cash flows, and staking a good portion of the company's future on the metaverse project.
Investors that believe that Meta has the capacity to overcome these hurdles may be more inclined to invest, but may want to make a good survey of the risks before making a decision.
New: Manage All Your Stock Portfolios in One Place
We've created the ultimate portfolio companion for stock investors, and it's free.
• Connect an unlimited number of Portfolios and see your total in one currency
• Be alerted to new Warning Signs or Risks via email or mobile
• Track the Fair Value of your stocks
Have feedback on this article? Concerned about the content? Get in touch with us directly. Alternatively, email editorial-team@simplywallst.com
Simply Wall St analyst Goran Damchevski and Simply Wall St have no position in any of the companies mentioned. This article is general in nature. We provide commentary based on historical data and analyst forecasts only using an unbiased methodology and our articles are not intended to be financial advice. It does not constitute a recommendation to buy or sell any stock and does not take account of your objectives, or your financial situation. We aim to bring you long-term focused analysis driven by fundamental data. Note that our analysis may not factor in the latest price-sensitive company announcements or qualitative material.

Goran Damchevski
Goran is an Equity Analyst and Writer at Simply Wall St with over 5 years of experience in financial analysis and company research. Goran previously worked in a seed-stage startup as a capital markets research analyst and product lead and developed a financial data platform for equity investors.
About NasdaqGS:META
Meta Platforms
Engages in the development of products that enable people to connect and share with friends and family through mobile devices, personal computers, virtual reality and mixed reality headsets, augmented reality, and wearables worldwide.
Undervalued with excellent balance sheet.
Similar Companies
Market Insights

Advertisement
Community Narratives
MicroVision will explode future revenue by 380.37% with a vision towards success
Fair Value US$60|98.4% undervalued
TH
Community Contributor
The Indispensable Artery for a New North American Economy
Fair Value CA$132.87|0.7% overvalued
TI
Community Contributor
Recently Updated Narratives
CO

composite32 on Astor Enerji ·
Astor Enerji will surge with a fair value of $140.43 in the next 3 years
Fair Value:₺140.4335.5% undervalued
1 followerusers have followed this narrative
0 commentsusers have commented on this narrative
0 likesusers have liked this narrative
RE

RecMag on Proximus ·
Proximus: The State-Backed Backup Plan with 7% Gross Yield and 15% Currency Upside.
Fair Value:€17.1356.7% undervalued
30 followersusers have followed this narrative
0 commentsusers have commented on this narrative
0 likesusers have liked this narrative
AG


Agricola on IMPACT Silver ·
A case for for IMPACT Silver Corp (TSXV:IPT) to reach USD $4.52 (CAD $6.16) in 2026 (23 bagger in 1 year) and USD $5.76 (CAD $7.89) by 2030
Fair Value:CA$7.8996.2% undervalued
1 followerusers have followed this narrative
0 commentsusers have commented on this narrative
0 likesusers have liked this narrative
Popular Narratives
TH

TheWallstreetKing on MicroVision ·
MicroVision will explode future revenue by 380.37% with a vision towards success
Fair Value:US$6098.4% undervalued
101 followersusers have followed this narrative
10 commentsusers have commented on this narrative
20 likesusers have liked this narrative
OS


oscargarcia on Alphabet ·
The company that turned a verb into a global necessity and basically runs the modern internet, digital ads, smartphones, maps, and AI.
Fair Value:US$3405.8% undervalued
139 followersusers have followed this narrative
6 commentsusers have commented on this narrative
18 likesusers have liked this narrative
AN


AnalystConsensusTarget on NVIDIA ·
NVDA: Expanding AI Demand Will Drive Major Data Center Investments Through 2026
Fair Value:US$250.3929.3% undervalued
932 followersusers have followed this narrative
6 commentsusers have commented on this narrative
23 likesusers have liked this narrative