
Advertisement
Key Insights
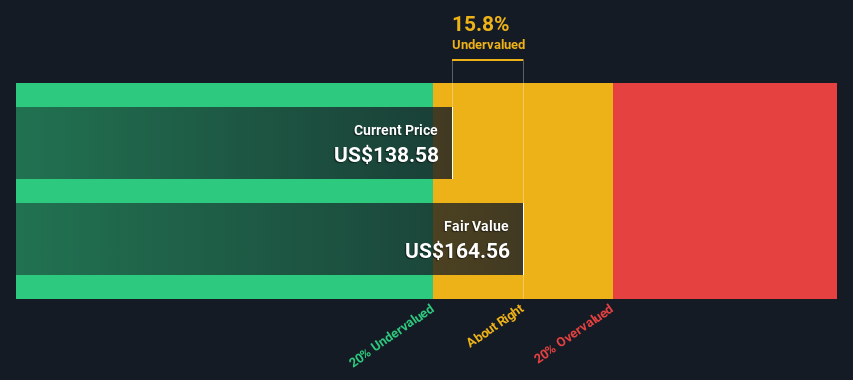
- Using the 2 Stage Free Cash Flow to Equity, Electronic Arts fair value estimate is US$165
- With US$139 share price, Electronic Arts appears to be trading close to its estimated fair value
- Analyst price target for EA is US$150 which is 9.0% below our fair value estimate
Today we will run through one way of estimating the intrinsic value of Electronic Arts Inc. (NASDAQ:EA) by taking the forecast future cash flows of the company and discounting them back to today's value. One way to achieve this is by employing the Discounted Cash Flow (DCF) model. Before you think you won't be able to understand it, just read on! It's actually much less complex than you'd imagine.
We would caution that there are many ways of valuing a company and, like the DCF, each technique has advantages and disadvantages in certain scenarios. If you still have some burning questions about this type of valuation, take a look at the Simply Wall St analysis model.
See our latest analysis for Electronic Arts
Crunching The Numbers
We're using the 2-stage growth model, which simply means we take in account two stages of company's growth. In the initial period the company may have a higher growth rate and the second stage is usually assumed to have a stable growth rate. To begin with, we have to get estimates of the next ten years of cash flows. Where possible we use analyst estimates, but when these aren't available we extrapolate the previous free cash flow (FCF) from the last estimate or reported value. We assume companies with shrinking free cash flow will slow their rate of shrinkage, and that companies with growing free cash flow will see their growth rate slow, over this period. We do this to reflect that growth tends to slow more in the early years than it does in later years.
Generally we assume that a dollar today is more valuable than a dollar in the future, and so the sum of these future cash flows is then discounted to today's value:
10-year free cash flow (FCF) forecast
| 2024 | 2025 | 2026 | 2027 | 2028 | 2029 | 2030 | 2031 | 2032 | 2033 | |
| Levered FCF ($, Millions) | US$1.83b | US$2.12b | US$2.25b | US$2.39b | US$2.55b | US$2.68b | US$2.79b | US$2.89b | US$2.98b | US$3.07b |
| Growth Rate Estimate Source | Analyst x9 | Analyst x10 | Analyst x8 | Analyst x3 | Analyst x3 | Est @ 4.95% | Est @ 4.13% | Est @ 3.56% | Est @ 3.16% | Est @ 2.88% |
| Present Value ($, Millions) Discounted @ 7.7% | US$1.7k | US$1.8k | US$1.8k | US$1.8k | US$1.8k | US$1.7k | US$1.7k | US$1.6k | US$1.5k | US$1.5k |
("Est" = FCF growth rate estimated by Simply Wall St)
Present Value of 10-year Cash Flow (PVCF) = US$17b
We now need to calculate the Terminal Value, which accounts for all the future cash flows after this ten year period. The Gordon Growth formula is used to calculate Terminal Value at a future annual growth rate equal to the 5-year average of the 10-year government bond yield of 2.2%. We discount the terminal cash flows to today's value at a cost of equity of 7.7%.
Terminal Value (TV)= FCF2033 × (1 + g) ÷ (r – g) = US$3.1b× (1 + 2.2%) ÷ (7.7%– 2.2%) = US$57b
Present Value of Terminal Value (PVTV)= TV / (1 + r)10= US$57b÷ ( 1 + 7.7%)10= US$27b
The total value is the sum of cash flows for the next ten years plus the discounted terminal value, which results in the Total Equity Value, which in this case is US$44b. The last step is to then divide the equity value by the number of shares outstanding. Compared to the current share price of US$139, the company appears about fair value at a 16% discount to where the stock price trades currently. The assumptions in any calculation have a big impact on the valuation, so it is better to view this as a rough estimate, not precise down to the last cent.
The Assumptions
Now the most important inputs to a discounted cash flow are the discount rate, and of course, the actual cash flows. If you don't agree with these result, have a go at the calculation yourself and play with the assumptions. The DCF also does not consider the possible cyclicality of an industry, or a company's future capital requirements, so it does not give a full picture of a company's potential performance. Given that we are looking at Electronic Arts as potential shareholders, the cost of equity is used as the discount rate, rather than the cost of capital (or weighted average cost of capital, WACC) which accounts for debt. In this calculation we've used 7.7%, which is based on a levered beta of 1.091. Beta is a measure of a stock's volatility, compared to the market as a whole. We get our beta from the industry average beta of globally comparable companies, with an imposed limit between 0.8 and 2.0, which is a reasonable range for a stable business.
SWOT Analysis for Electronic Arts
Strength
- Earnings growth over the past year exceeded its 5-year average.
- Debt is not viewed as a risk.
Weakness
- Earnings growth over the past year underperformed the Entertainment industry.
- Dividend is low compared to the top 25% of dividend payers in the Entertainment market.
Opportunity
- Annual earnings are forecast to grow for the next 3 years.
- Current share price is below our estimate of fair value.
Threat
- Annual earnings are forecast to grow slower than the American market.
Next Steps:
Whilst important, the DCF calculation is only one of many factors that you need to assess for a company. DCF models are not the be-all and end-all of investment valuation. Rather it should be seen as a guide to "what assumptions need to be true for this stock to be under/overvalued?" If a company grows at a different rate, or if its cost of equity or risk free rate changes sharply, the output can look very different. For Electronic Arts, we've compiled three fundamental elements you should consider:
- Risks: To that end, you should be aware of the 1 warning sign we've spotted with Electronic Arts .
- Management:Have insiders been ramping up their shares to take advantage of the market's sentiment for EA's future outlook? Check out our management and board analysis with insights on CEO compensation and governance factors.
- Other Solid Businesses: Low debt, high returns on equity and good past performance are fundamental to a strong business. Why not explore our interactive list of stocks with solid business fundamentals to see if there are other companies you may not have considered!
PS. Simply Wall St updates its DCF calculation for every American stock every day, so if you want to find the intrinsic value of any other stock just search here.
Valuation is complex, but we're here to simplify it.
Discover if Electronic Arts might be undervalued or overvalued with our detailed analysis, featuring fair value estimates, potential risks, dividends, insider trades, and its financial condition.
Access Free AnalysisHave feedback on this article? Concerned about the content? Get in touch with us directly. Alternatively, email editorial-team (at) simplywallst.com.
This article by Simply Wall St is general in nature. We provide commentary based on historical data and analyst forecasts only using an unbiased methodology and our articles are not intended to be financial advice. It does not constitute a recommendation to buy or sell any stock, and does not take account of your objectives, or your financial situation. We aim to bring you long-term focused analysis driven by fundamental data. Note that our analysis may not factor in the latest price-sensitive company announcements or qualitative material. Simply Wall St has no position in any stocks mentioned.
About NasdaqGS:EA
Electronic Arts
Develops, markets, publishes, and delivers games, content, and services for game consoles, PCs, and mobile phones worldwide.
Adequate balance sheet and slightly overvalued.
Similar Companies
Market Insights

Advertisement
Community Narratives
Pinterest will surge as advertising innovations ignite revenue growth
Fair Value US$42.63|26.3% undervalued
BR
Community Contributor
Brambles' Revenue Set to Climb 14% with Profit Margins Following
Fair Value AU$21.90|4.8% overvalued
RO
Community Contributor
Challenging Future for STG as Organic Sales Decline by 8.8%
Fair Value DKK 116.13|26.8% undervalued
KA
Community Contributor