Advertisement
- United States
- /
- Media
- /
- NasdaqGS:CMCSA
Is Comcast’s Stock Decline an Opportunity After 2026 Super Bowl Ad Sellout?

Simply Wall St
Reviewed by Bailey Pemberton
If you have looked at Comcast's stock chart lately, you're probably asking yourself if all these twists and turns really mean opportunity or signal something more ominous. This year, Comcast shares have been on a bit of a roller coaster, falling 2.6% just in the past week and losing nearly 10% over the past month. Year-to-date, the drop sits at 18.2%, with the one-year decline at 22.5%. Even the five-year number is solidly negative. Interestingly, if you zoom out to the last three years, the stock has actually gained 17.4%.
So what’s fueling these wild moves? Recent news hasn’t steadied the ship. Job cuts in Comcast’s biggest division, headline-making carriage disputes with YouTube TV, and media industry legal battles have all played their part in shaking up both investors’ expectations and the company’s risk profile. Not all the headlines are storm clouds, however. NBCUniversal managed to sell out its 2026 Super Bowl ad slots well ahead of schedule, which bodes well for revenue in its media arm.
Given so much turbulence, it’s fair to wonder if the market has overreacted or if Comcast is truly adjusting to a new, lower baseline. If you’re weighing whether now is the time to buy, sell, or simply hold on, valuation is a great starting point. Here’s a number that stands out: by our assessment, Comcast scores 6 out of 6 on major undervaluation checks, meaning it comes up as undervalued across the board. Let's break down those valuation methods in detail, and before we’re done, I’ll show you an even better way to think about value—one that most investors overlook.
Why Comcast is lagging behind its peers
Approach 1: Comcast Discounted Cash Flow (DCF) Analysis
The Discounted Cash Flow (DCF) model estimates a company's value by forecasting its future cash flows and then discounting them back to today’s dollars. This approach gives investors a sense of what those future earnings are really worth in present terms. For Comcast, this analysis uses a two-stage approach and focuses on Free Cash Flow to Equity.
Comcast currently generates about $15.8 Billion in Free Cash Flow, measured in dollars. Analyst estimates provide projections up to 2029, predicting Free Cash Flow to reach roughly $16.3 Billion. Beyond 2029, Simply Wall St extrapolates the outlook, with the forecast rising to nearly $17.9 Billion by 2035. These projections are converted into today’s value using discount rates, which reflect the risk and time value of money.
Based on this DCF model, Comcast's intrinsic value is calculated to be $74.09 per share. This suggests the stock is trading at a significant 58.7% discount to its estimated value. In simple terms, this means the market price is much lower than what the future cash flows justify and Comcast appears deeply undervalued according to this method.
Result: UNDERVALUED
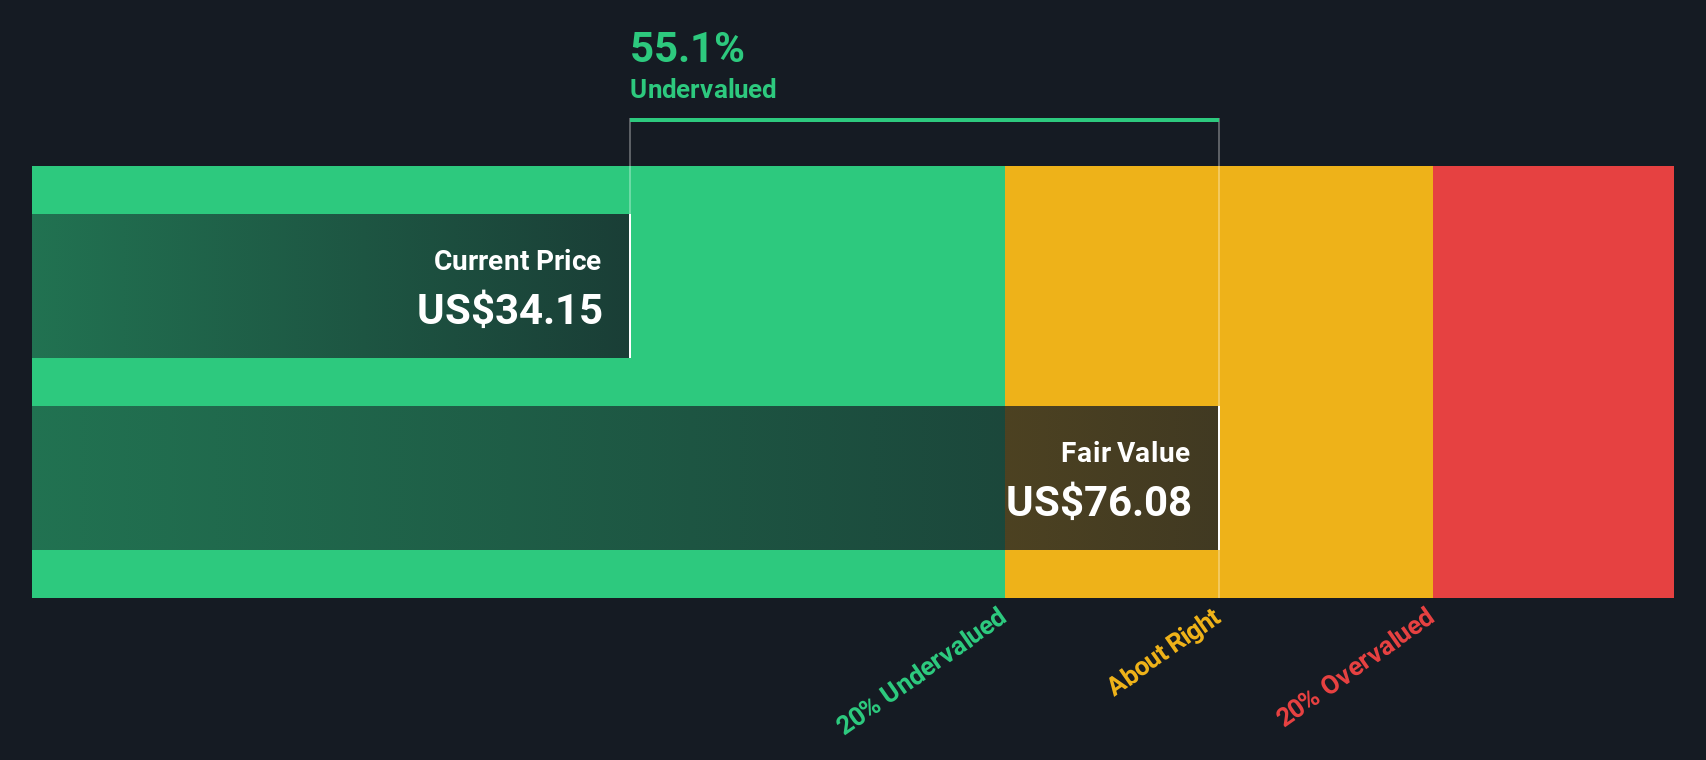
Our Discounted Cash Flow (DCF) analysis suggests Comcast is undervalued by 58.7%. Track this in your watchlist or portfolio, or discover more undervalued stocks.
Approach 2: Comcast Price vs Earnings
The Price-to-Earnings (PE) ratio is often considered the gold standard for valuing profitable businesses like Comcast. It allows investors to gauge how much they are paying for each dollar of the company’s earnings. In general, businesses with higher growth expectations and lower perceived risks tend to command higher PE ratios, while riskier or slower-growing companies warrant a lower ratio.
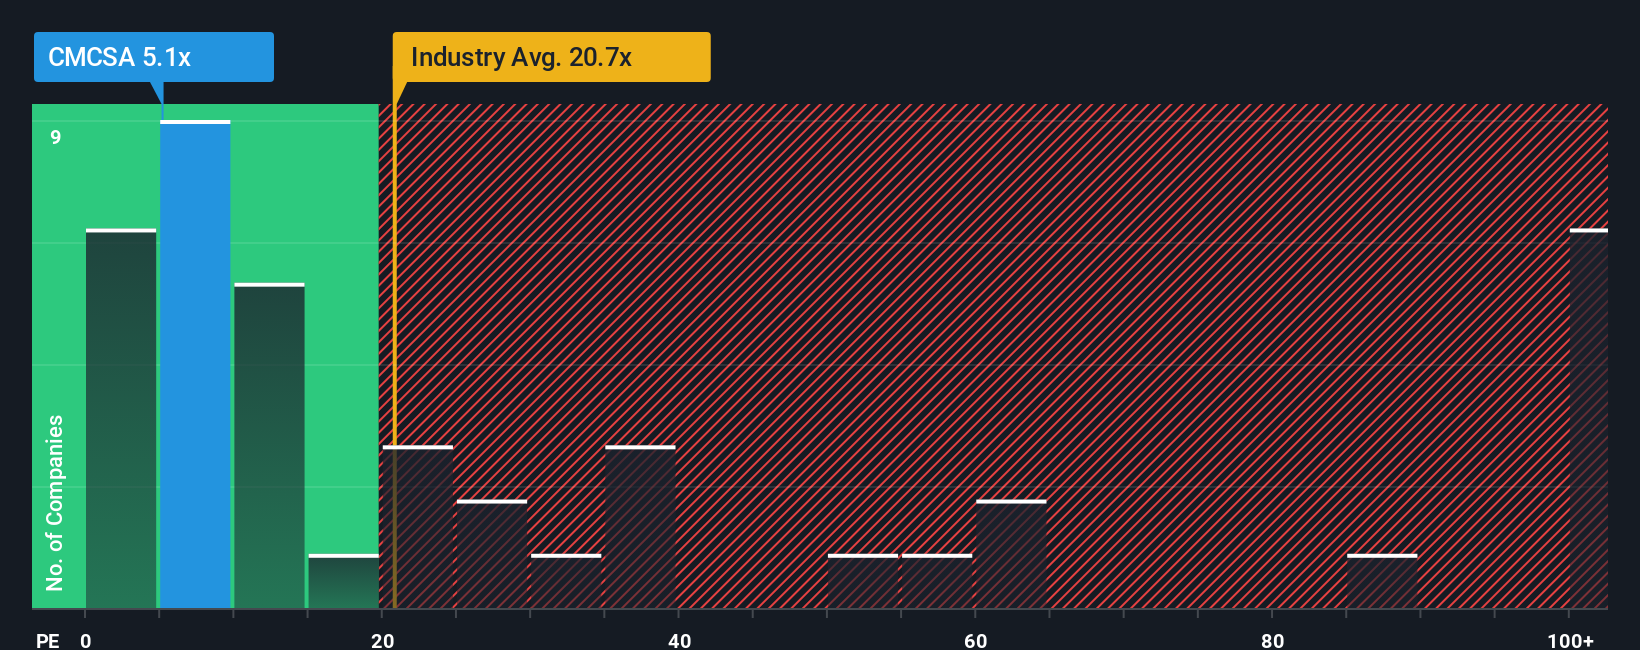
Comcast’s current PE ratio stands at just 4.93x, which is dramatically lower than the Media industry average of 20.47x and its peer average of 45.56x. At first glance, this suggests that Comcast is trading at a significant discount relative to its rivals and the wider industry. However, simply comparing multiples can be misleading, as these numbers do not always account for company-specific factors that affect what is truly “fair.”
This is where Simply Wall St’s “Fair Ratio” comes into play. Unlike industry and peer averages, the Fair Ratio, calculated at 18.20x for Comcast, blends important factors such as earnings growth, market cap, profit margins, industry characteristics, and risk profile. This holistic perspective offers a more tailored benchmark for each company, helping you avoid the pitfalls of one-size-fits-all comparisons.
Comparing Comcast’s actual PE ratio of 4.93x to its Fair Ratio of 18.20x indicates that the stock is trading well below what would be expected given its financial profile and industry conditions. This supports the view that Comcast shares are currently undervalued.
Result: UNDERVALUED
PE ratios tell one story, but what if the real opportunity lies elsewhere? Discover companies where insiders are betting big on explosive growth.
Upgrade Your Decision Making: Choose your Comcast Narrative
Earlier we mentioned that there is an even better way to understand valuation, so let's introduce you to Narratives. A Narrative is your personal investment story that explains what you believe about a company’s future, your own estimates of its fair value, revenue growth, and profit margins, anchored by real world events and forecasts.
By linking a company’s story (why you think it will succeed or struggle) directly to a customizable financial forecast and resulting fair value, Narratives let you move beyond static ratios and see at a glance how changes in performance or outlook should affect your buy, sell, or hold decisions.
Simply Wall St’s platform makes crafting and tracking Narratives easy and accessible: millions of investors use them in the Community page to share perspectives and compare assumptions in real time.
Importantly, Narratives are dynamic. They update automatically when new news or earnings come in, so your view stays relevant and actionable.
For Comcast, for example, some investors take a bullish Narrative with a fair value target as high as $49.43, while others see more downside risk, assigning a fair value as low as $31.00.
Do you think there's more to the story for Comcast? Create your own Narrative to let the Community know!

This article by Simply Wall St is general in nature. We provide commentary based on historical data and analyst forecasts only using an unbiased methodology and our articles are not intended to be financial advice. It does not constitute a recommendation to buy or sell any stock, and does not take account of your objectives, or your financial situation. We aim to bring you long-term focused analysis driven by fundamental data. Note that our analysis may not factor in the latest price-sensitive company announcements or qualitative material. Simply Wall St has no position in any stocks mentioned.
New: AI Stock Screener & Alerts
Our new AI Stock Screener scans the market every day to uncover opportunities.
• Dividend Powerhouses (3%+ Yield)
• Undervalued Small Caps with Insider Buying
• High growth Tech and AI Companies
Or build your own from over 50 metrics.
Have feedback on this article? Concerned about the content? Get in touch with us directly. Alternatively, email editorial-team@simplywallst.com
About NasdaqGS:CMCSA
Very undervalued with solid track record and pays a dividend.
Similar Companies
Market Insights

Advertisement
Community Narratives
A formidable player in AI and enterprise computing.
Fair Value US$210.00|0.7% overvalued
CO
Community Contributor
IREN's Bold Moves in Sustainable Bitcoin Mining & AI Data Centers
Fair Value US$72.52|14.9% undervalued
BL
Community Contributor
Cooling the Champions: The Aussie Tech Behind F1's Victories
Fair Value AU$12.40|38.1% undervalued
TR
Community Contributor