
Advertisement
- United States
- /
- Interactive Media and Services
- /
- NasdaqCM:CHR
Positive Sentiment Still Eludes Cheer Holding, Inc. (NASDAQ:CHR) Following 27% Share Price Slump

Unfortunately for some shareholders, the Cheer Holding, Inc. (NASDAQ:CHR) share price has dived 27% in the last thirty days, prolonging recent pain. The recent drop completes a disastrous twelve months for shareholders, who are sitting on a 74% loss during that time.
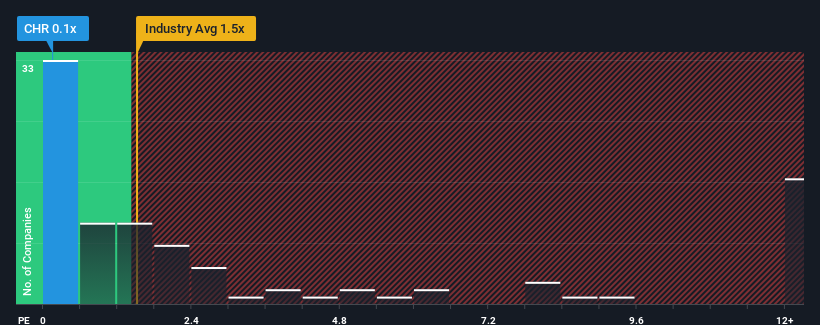
After such a large drop in price, Cheer Holding's price-to-sales (or "P/S") ratio of 0.1x might make it look like a buy right now compared to the Interactive Media and Services industry in the United States, where around half of the companies have P/S ratios above 1.5x and even P/S above 4x are quite common. Although, it's not wise to just take the P/S at face value as there may be an explanation why it's limited.
Check out our latest analysis for Cheer Holding
How Has Cheer Holding Performed Recently?
For example, consider that Cheer Holding's financial performance has been pretty ordinary lately as revenue growth is non-existent. Perhaps the market believes the recent lacklustre revenue performance is a sign of future underperformance relative to industry peers, hurting the P/S. If you like the company, you'd be hoping this isn't the case so that you could potentially pick up some stock while it's out of favour.
Want the full picture on earnings, revenue and cash flow for the company? Then our free report on Cheer Holding will help you shine a light on its historical performance.What Are Revenue Growth Metrics Telling Us About The Low P/S?
Cheer Holding's P/S ratio would be typical for a company that's only expected to deliver limited growth, and importantly, perform worse than the industry.
Retrospectively, the last year delivered virtually the same number to the company's top line as the year before. Still, the latest three year period has seen an excellent 149% overall rise in revenue, in spite of its uninspiring short-term performance. So while the company has done a solid job in the past, it's somewhat concerning to see revenue growth decline as much as it has.
Comparing that recent medium-term revenue trajectory with the industry's one-year growth forecast of 14% shows it's noticeably more attractive.
With this information, we find it odd that Cheer Holding is trading at a P/S lower than the industry. It looks like most investors are not convinced the company can maintain its recent growth rates.
What We Can Learn From Cheer Holding's P/S?
The southerly movements of Cheer Holding's shares means its P/S is now sitting at a pretty low level. It's argued the price-to-sales ratio is an inferior measure of value within certain industries, but it can be a powerful business sentiment indicator.
We're very surprised to see Cheer Holding currently trading on a much lower than expected P/S since its recent three-year growth is higher than the wider industry forecast. When we see robust revenue growth that outpaces the industry, we presume that there are notable underlying risks to the company's future performance, which is exerting downward pressure on the P/S ratio. It appears many are indeed anticipating revenue instability, because the persistence of these recent medium-term conditions would normally provide a boost to the share price.
It's always necessary to consider the ever-present spectre of investment risk. We've identified 3 warning signs with Cheer Holding, and understanding them should be part of your investment process.
Of course, profitable companies with a history of great earnings growth are generally safer bets. So you may wish to see this free collection of other companies that have reasonable P/E ratios and have grown earnings strongly.
New: AI Stock Screener & Alerts
Our new AI Stock Screener scans the market every day to uncover opportunities.
• Dividend Powerhouses (3%+ Yield)
• Undervalued Small Caps with Insider Buying
• High growth Tech and AI Companies
Or build your own from over 50 metrics.
Have feedback on this article? Concerned about the content? Get in touch with us directly. Alternatively, email editorial-team (at) simplywallst.com.
This article by Simply Wall St is general in nature. We provide commentary based on historical data and analyst forecasts only using an unbiased methodology and our articles are not intended to be financial advice. It does not constitute a recommendation to buy or sell any stock, and does not take account of your objectives, or your financial situation. We aim to bring you long-term focused analysis driven by fundamental data. Note that our analysis may not factor in the latest price-sensitive company announcements or qualitative material. Simply Wall St has no position in any stocks mentioned.
About NasdaqCM:CHR
Cheer Holding
Through its subsidiaries, provides advertisement and content production services in the People’s Republic of China.
Flawless balance sheet moderate.
Similar Companies
Market Insights

Advertisement
Community Narratives
WhiteCap Is Positioned To Profit Regardless Of Trump's Policy 
Fair Value CA$22.60|61.6% undervalued
ST
Equity Analyst and Writer
Microsoft's Evolution Will Drive Revenue to New Heights Fueled by AI
Fair Value US$360.00|28.6% overvalued
BR
Community Contributor
A CASE FOR USD$2.50 (CAD$3.44) BY 2028 (A 5-10 BAGGER)
Fair Value CA$3.44|87.5% undervalued
AG
Community Contributor