
Advertisement
Legendary fund manager Li Lu (who Charlie Munger backed) once said, 'The biggest investment risk is not the volatility of prices, but whether you will suffer a permanent loss of capital.' It's only natural to consider a company's balance sheet when you examine how risky it is, since debt is often involved when a business collapses. We can see that Ranpak Holdings Corp. (NYSE:PACK) does use debt in its business. But is this debt a concern to shareholders?
When Is Debt Dangerous?
Debt and other liabilities become risky for a business when it cannot easily fulfill those obligations, either with free cash flow or by raising capital at an attractive price. Ultimately, if the company can't fulfill its legal obligations to repay debt, shareholders could walk away with nothing. While that is not too common, we often do see indebted companies permanently diluting shareholders because lenders force them to raise capital at a distressed price. By replacing dilution, though, debt can be an extremely good tool for businesses that need capital to invest in growth at high rates of return. When we examine debt levels, we first consider both cash and debt levels, together.
See our latest analysis for Ranpak Holdings
What Is Ranpak Holdings's Debt?
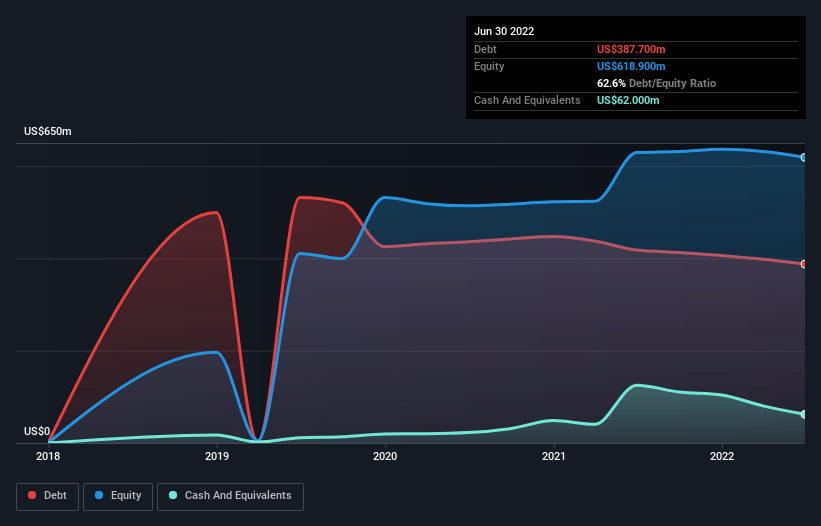
You can click the graphic below for the historical numbers, but it shows that Ranpak Holdings had US$387.7m of debt in June 2022, down from US$418.1m, one year before. On the flip side, it has US$62.0m in cash leading to net debt of about US$325.7m.
How Strong Is Ranpak Holdings' Balance Sheet?
According to the last reported balance sheet, Ranpak Holdings had liabilities of US$53.6m due within 12 months, and liabilities of US$491.4m due beyond 12 months. Offsetting this, it had US$62.0m in cash and US$49.1m in receivables that were due within 12 months. So its liabilities total US$433.9m more than the combination of its cash and short-term receivables.
Given this deficit is actually higher than the company's market capitalization of US$433.6m, we think shareholders really should watch Ranpak Holdings's debt levels, like a parent watching their child ride a bike for the first time. Hypothetically, extremely heavy dilution would be required if the company were forced to pay down its liabilities by raising capital at the current share price. The balance sheet is clearly the area to focus on when you are analysing debt. But ultimately the future profitability of the business will decide if Ranpak Holdings can strengthen its balance sheet over time. So if you want to see what the professionals think, you might find this free report on analyst profit forecasts to be interesting.
Over 12 months, Ranpak Holdings reported revenue of US$376m, which is a gain of 8.4%, although it did not report any earnings before interest and tax. That rate of growth is a bit slow for our taste, but it takes all types to make a world.
Caveat Emptor
Importantly, Ranpak Holdings had an earnings before interest and tax (EBIT) loss over the last year. To be specific the EBIT loss came in at US$15m. When we look at that alongside the significant liabilities, we're not particularly confident about the company. We'd want to see some strong near-term improvements before getting too interested in the stock. Not least because it burned through US$46m in negative free cash flow over the last year. So suffice it to say we consider the stock to be risky. There's no doubt that we learn most about debt from the balance sheet. But ultimately, every company can contain risks that exist outside of the balance sheet. For example - Ranpak Holdings has 2 warning signs we think you should be aware of.
If you're interested in investing in businesses that can grow profits without the burden of debt, then check out this free list of growing businesses that have net cash on the balance sheet.
New: AI Stock Screener & Alerts
Our new AI Stock Screener scans the market every day to uncover opportunities.
• Dividend Powerhouses (3%+ Yield)
• Undervalued Small Caps with Insider Buying
• High growth Tech and AI Companies
Or build your own from over 50 metrics.
Have feedback on this article? Concerned about the content? Get in touch with us directly. Alternatively, email editorial-team (at) simplywallst.com.
This article by Simply Wall St is general in nature. We provide commentary based on historical data and analyst forecasts only using an unbiased methodology and our articles are not intended to be financial advice. It does not constitute a recommendation to buy or sell any stock, and does not take account of your objectives, or your financial situation. We aim to bring you long-term focused analysis driven by fundamental data. Note that our analysis may not factor in the latest price-sensitive company announcements or qualitative material. Simply Wall St has no position in any stocks mentioned.
About NYSE:PACK
Ranpak Holdings
Provides product protection solutions and end-of-line automation solutions for e-commerce and industrial supply chains in North America, Europe, and Asia.
Mediocre balance sheet with very low risk.
Similar Companies
Market Insights

Advertisement
Community Narratives
Quality at a Premium. A time to watch, not to buy?
Fair Value US$154.56|30.1% undervalued
DA
Community Contributor
GRAB: The Super-App at the Heart of Southeast Asia’s Digital Boom
Fair Value US$8.20|25.6% undervalued
BL
Community Contributor
Verve Group to Surge with 51.61% Revenue Growth
Fair Value €6.00|63.2% undervalued
ME
Community Contributor