- United States
- /
- Packaging
- /
- NYSE:OI
A Piece Of The Puzzle Missing From O-I Glass, Inc.'s (NYSE:OI) 26% Share Price Climb
O-I Glass, Inc. (NYSE:OI) shares have had a really impressive month, gaining 26% after a shaky period beforehand. Unfortunately, the gains of the last month did little to right the losses of the last year with the stock still down 36% over that time.
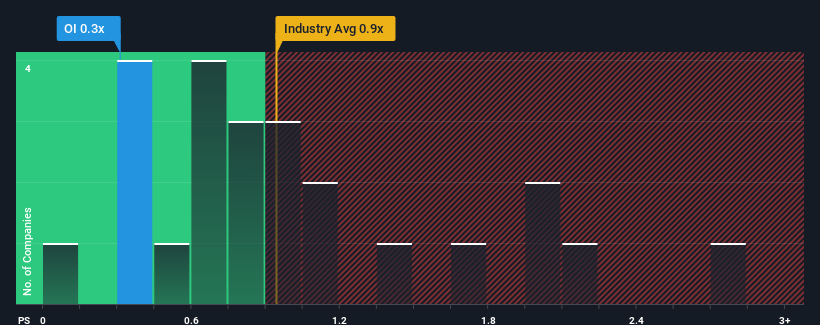
In spite of the firm bounce in price, given about half the companies operating in the United States' Packaging industry have price-to-sales ratios (or "P/S") above 0.9x, you may still consider O-I Glass as an attractive investment with its 0.3x P/S ratio. Nonetheless, we'd need to dig a little deeper to determine if there is a rational basis for the reduced P/S.
View our latest analysis for O-I Glass

What Does O-I Glass' P/S Mean For Shareholders?
There hasn't been much to differentiate O-I Glass' and the industry's retreating revenue lately. Perhaps the market is expecting future revenue performance to deteriorate further, which has kept the P/S suppressed. If you still like the company, you'd want its revenue trajectory to turn around before making any decisions. At the very least, you'd be hoping that revenue doesn't fall off a cliff if your plan is to pick up some stock while it's out of favour.
Want the full picture on analyst estimates for the company? Then our free report on O-I Glass will help you uncover what's on the horizon.Do Revenue Forecasts Match The Low P/S Ratio?
The only time you'd be truly comfortable seeing a P/S as low as O-I Glass' is when the company's growth is on track to lag the industry.
Taking a look back first, the company's revenue growth last year wasn't something to get excited about as it posted a disappointing decline of 5.7%. This has soured the latest three-year period, which nevertheless managed to deliver a decent 6.9% overall rise in revenue. So we can start by confirming that the company has generally done a good job of growing revenue over that time, even though it had some hiccups along the way.
Turning to the outlook, the next three years should generate growth of 2.4% per annum as estimated by the nine analysts watching the company. With the industry predicted to deliver 3.6% growth per year, the company is positioned for a comparable revenue result.
With this information, we find it odd that O-I Glass is trading at a P/S lower than the industry. Apparently some shareholders are doubtful of the forecasts and have been accepting lower selling prices.
The Bottom Line On O-I Glass' P/S
Despite O-I Glass' share price climbing recently, its P/S still lags most other companies. It's argued the price-to-sales ratio is an inferior measure of value within certain industries, but it can be a powerful business sentiment indicator.
Our examination of O-I Glass' revealed that its P/S remains low despite analyst forecasts of revenue growth matching the wider industry. When we see middle-of-the-road revenue growth like this, we assume it must be the potential risks that are what is placing pressure on the P/S ratio. At least the risk of a price drop looks to be subdued, but investors seem to think future revenue could see some volatility.
Having said that, be aware O-I Glass is showing 1 warning sign in our investment analysis, you should know about.
It's important to make sure you look for a great company, not just the first idea you come across. So if growing profitability aligns with your idea of a great company, take a peek at this free list of interesting companies with strong recent earnings growth (and a low P/E).
New: AI Stock Screener & Alerts
Our new AI Stock Screener scans the market every day to uncover opportunities.
• Dividend Powerhouses (3%+ Yield)
• Undervalued Small Caps with Insider Buying
• High growth Tech and AI Companies
Or build your own from over 50 metrics.
Have feedback on this article? Concerned about the content? Get in touch with us directly. Alternatively, email editorial-team (at) simplywallst.com.
This article by Simply Wall St is general in nature. We provide commentary based on historical data and analyst forecasts only using an unbiased methodology and our articles are not intended to be financial advice. It does not constitute a recommendation to buy or sell any stock, and does not take account of your objectives, or your financial situation. We aim to bring you long-term focused analysis driven by fundamental data. Note that our analysis may not factor in the latest price-sensitive company announcements or qualitative material. Simply Wall St has no position in any stocks mentioned.
Have feedback on this article? Concerned about the content? Get in touch with us directly. Alternatively, email editorial-team@simplywallst.com
About NYSE:OI
O-I Glass
Through its subsidiaries, engages in the manufacture and sale of glass containers to food and beverage manufacturers primarily in the Americas, Europe, and internationally.
Very undervalued with reasonable growth potential.
Similar Companies
Market Insights
Community Narratives


Recently Updated Narratives


Alphabet: The Under-appreciated Compounder Hiding in Plain Sight


MINISO's fair value is projected at 26.69 with an anticipated PE ratio shift of 20x


The Quiet Giant That Became AI’s Power Grid
Popular Narratives


The company that turned a verb into a global necessity and basically runs the modern internet, digital ads, smartphones, maps, and AI.


MicroVision will explode future revenue by 380.37% with a vision towards success


