Advertisement
- United States
- /
- Metals and Mining
- /
- NYSE:NEM
Does Newmont’s 145% 2025 Rally Match Its Gold Fueled Earnings and Cash Flow Outlook?

Simply Wall St
Reviewed by Bailey Pemberton
- If you have been wondering whether Newmont is still a buy after its big run, you are not alone. This breakdown will walk through whether the current price still stacks up against its underlying value.
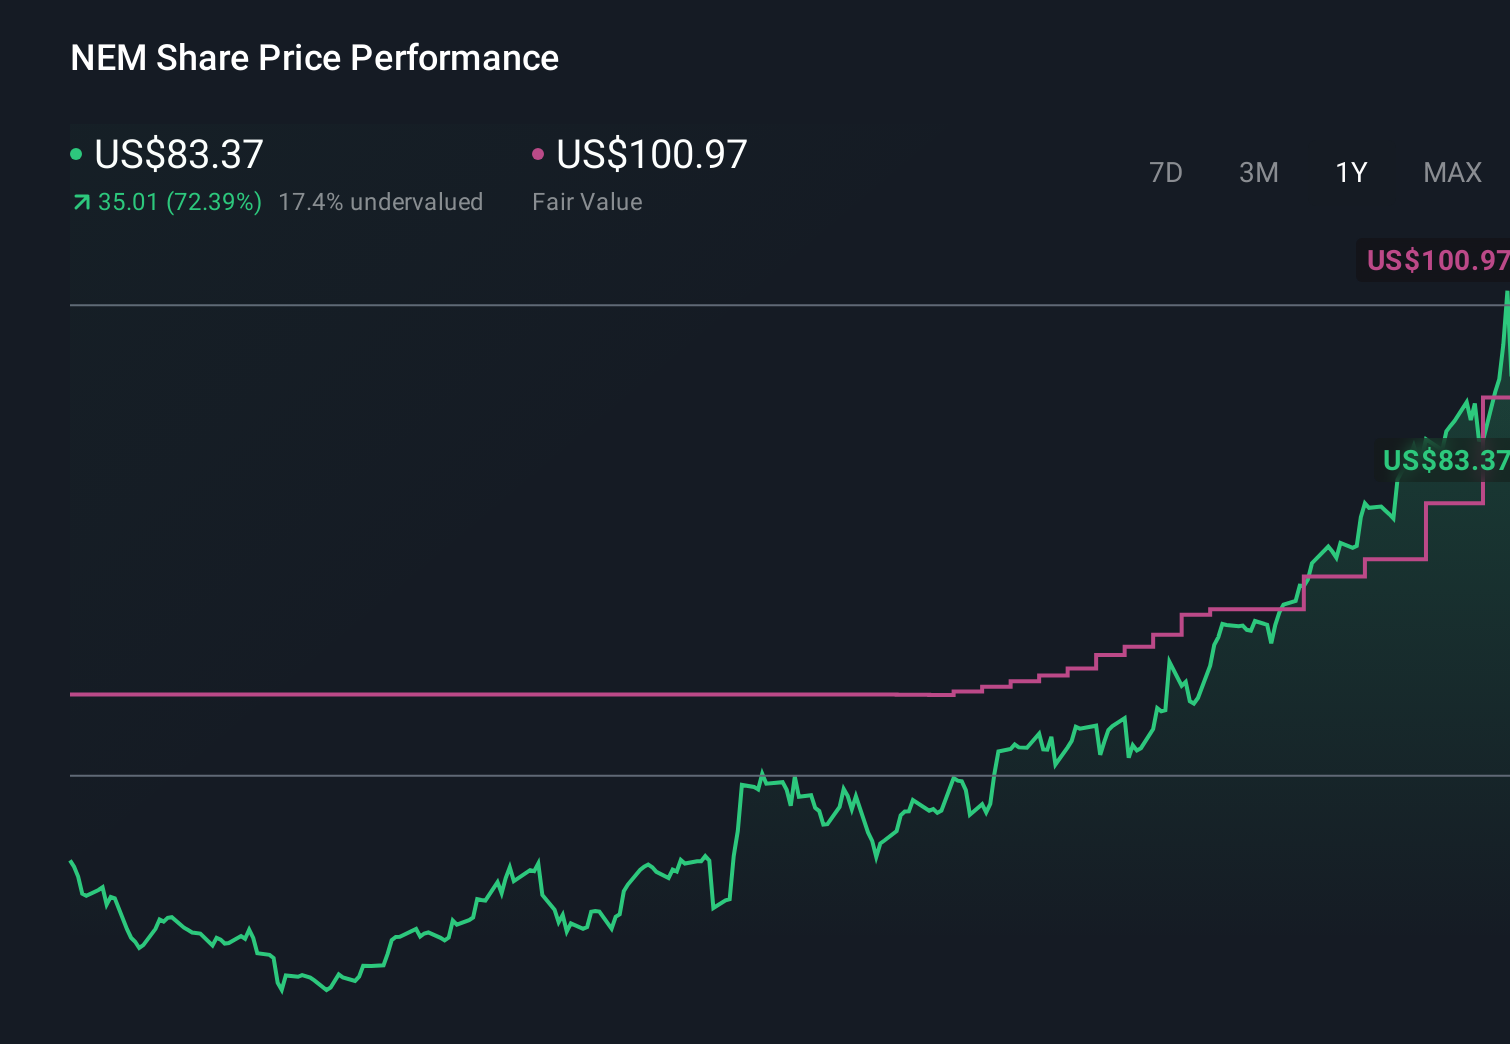
- The stock has climbed 5.0% over the last week, 6.6% over the last month, and is up 145.2% year to date, with a 126.3% gain over the past year that has dramatically changed how the market is pricing its prospects.
- Recent months have seen a strong tailwind from higher gold prices and renewed interest in precious metals miners as investors look for hedges against inflation and macro uncertainty. At the same time, Newmont's focus on streamlining its asset base and advancing key projects has reinforced the narrative that it could be better positioned for sustained cash flow than in past cycles.
- Right now, Newmont scores a 5/6 valuation score, suggesting the market may still be underestimating it on several metrics. In the sections ahead we will unpack how different valuation approaches arrive at that view and hint at an even more intuitive way to think about its true worth by the end of the article.
Approach 1: Newmont Discounted Cash Flow (DCF) Analysis
A Discounted Cash Flow model estimates what a company is worth by projecting the cash it can generate in the future and then discounting those cash flows back to today's value.
For Newmont, the latest twelve month Free Cash Flow sits at about $5.3 billion, and analysts expect this to grow steadily over the coming decade as projects ramp up and gold prices support margins. By 2029, annual Free Cash Flow is projected to be around $8.0 billion, with further years extrapolated by Simply Wall St using a two stage Free Cash Flow to Equity framework that tapers growth as the business matures.
When all projected cash flows are discounted back to today, the model arrives at an intrinsic value of roughly $124.59 per share. Compared with the current market price, this implies Newmont trades at about a 24.5% discount, which indicates the market is still not fully pricing in its anticipated cash generation.
Result: UNDERVALUED
Our Discounted Cash Flow (DCF) analysis suggests Newmont is undervalued by 24.5%. Track this in your watchlist or portfolio, or discover 900 more undervalued stocks based on cash flows.

Approach 2: Newmont Price vs Earnings
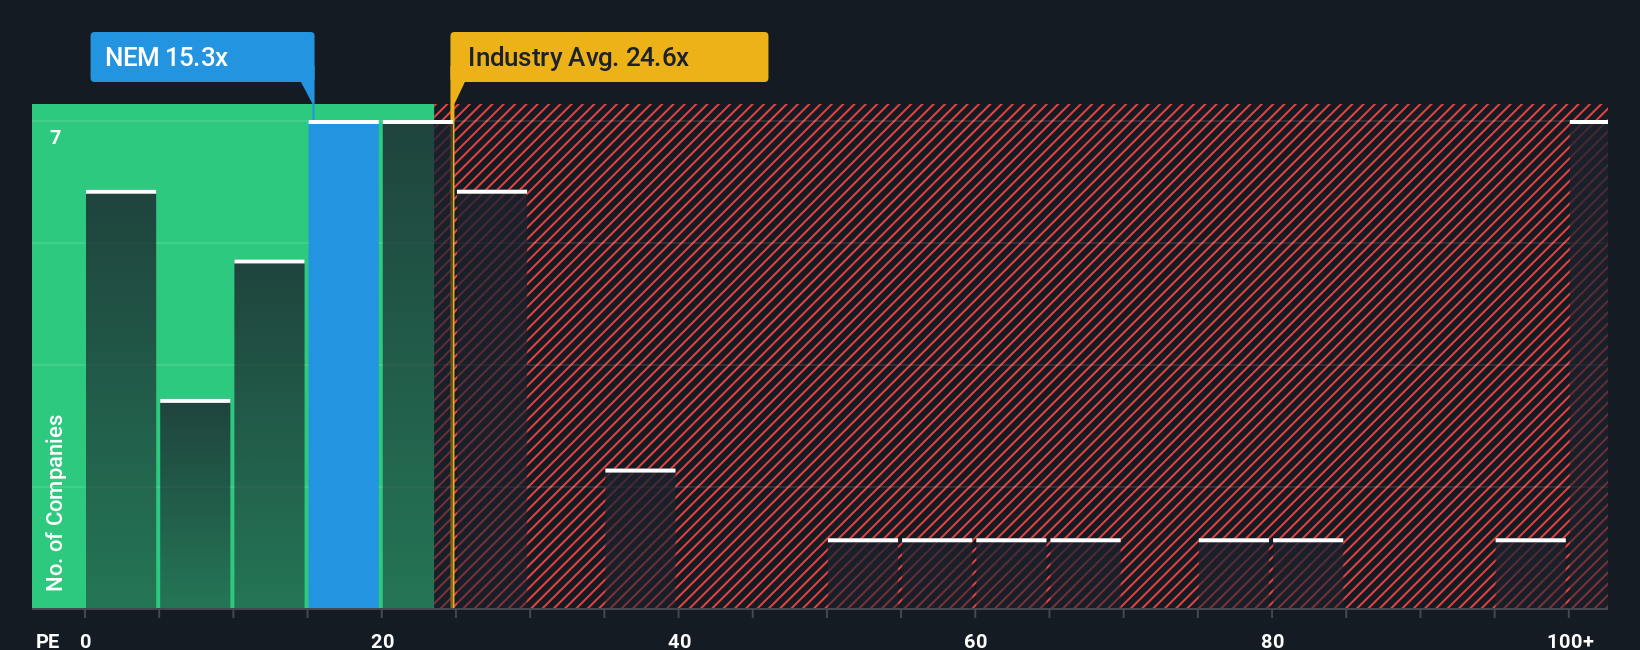
For a profitable business like Newmont, the Price to Earnings (PE) ratio is a useful shorthand for how much investors are willing to pay today for each dollar of current earnings. It naturally reflects expectations for future growth and the risks around those earnings, so faster growing or more resilient companies typically justify higher PE ratios, while slower or more volatile names tend to trade on lower multiples.
Newmont currently trades on a PE of about 14.3x. That sits well below both the broader metals and mining industry average of roughly 22.1x and the peer group average of around 25.8x, indicating the market is valuing its earnings more conservatively than many of its closest comparables. Simply Wall St’s proprietary Fair Ratio for Newmont comes in at 23.7x. This metric is designed to capture what a reasonable PE should be after adjusting for factors such as its earnings growth outlook, risk profile, profit margins, industry characteristics and market cap. Because this approach directly incorporates company specific fundamentals, it provides a more tailored benchmark than a simple comparison with peers or the sector.
Comparing Newmont’s actual PE of 14.3x to the Fair Ratio of 23.7x suggests the shares are trading at a meaningful discount to what its fundamentals would imply.
Result: UNDERVALUED
PE ratios tell one story, but what if the real opportunity lies elsewhere? Discover 1450 companies where insiders are betting big on explosive growth.
Upgrade Your Decision Making: Choose your Newmont Narrative
Earlier we mentioned that there is an even better way to understand valuation. Let us introduce you to Narratives, an easy tool on Simply Wall St’s Community page that lets you attach your own story about Newmont’s future revenue, earnings and margins to a financial forecast. You can then turn that into a Fair Value, and continuously compare that Fair Value with the current share price to decide whether to buy, hold or sell. An added benefit is that your Narrative automatically updates when new information like earnings or major news drops. One investor might build a bullish Newmont Narrative around a constructive gold cycle, successful integration of acquisitions and strong ESG execution that supports a Fair Value near the upper end of current estimates. Another might take a more cautious view that emphasizes operational risks, rising costs and leadership transitions to arrive at a much lower Fair Value. Both perspectives can coexist transparently on the platform so you can see how different stories, not just different numbers, drive different investment decisions.
Do you think there's more to the story for Newmont? Head over to our Community to see what others are saying!
This article by Simply Wall St is general in nature. We provide commentary based on historical data and analyst forecasts only using an unbiased methodology and our articles are not intended to be financial advice. It does not constitute a recommendation to buy or sell any stock, and does not take account of your objectives, or your financial situation. We aim to bring you long-term focused analysis driven by fundamental data. Note that our analysis may not factor in the latest price-sensitive company announcements or qualitative material. Simply Wall St has no position in any stocks mentioned.
Valuation is complex, but we're here to simplify it.
Discover if Newmont might be undervalued or overvalued with our detailed analysis, featuring fair value estimates, potential risks, dividends, insider trades, and its financial condition.
Access Free AnalysisHave feedback on this article? Concerned about the content? Get in touch with us directly. Alternatively, email editorial-team@simplywallst.com
About NYSE:NEM
Undervalued with excellent balance sheet.
Similar Companies
Market Insights

Advertisement
Weekly Picks
WO

woodworthfund on MGP Ingredients ·
THE KINGDOM OF BROWN GOODS: WHY MGPI IS BEING CRUSHED BY INVENTORY & PRIMED FOR RESURRECTION
Fair Value:US$4039.0% undervalued
6 followersusers have followed this narrative
0 commentsusers have commented on this narrative
3 likesusers have liked this narrative
DO


Double_Bubbler on Vertical Aerospace ·
Why Vertical Aerospace (NYSE: EVTL) is Worth Possibly Over 13x its Current Price
Fair Value:US$6087.9% undervalued
8 followersusers have followed this narrative
1 commentusers have commented on this narrative
8 likesusers have liked this narrative
TI


TickerTickle on Oracle ·
The Quiet Giant That Became AI’s Power Grid
Fair Value:US$389.8143.2% undervalued
21 followersusers have followed this narrative
1 commentusers have commented on this narrative
5 likesusers have liked this narrative
Recently Updated Narratives
NO

Norms70 on Standard Lithium ·
SLI is share to watch next 5 years
Fair Value:€4.57.6% undervalued
2 followersusers have followed this narrative
0 commentsusers have commented on this narrative
0 likesusers have liked this narrative
DA


davidlsander on Beam Therapeutics ·
The "Molecular Pencil": Why Beam's Technology is Built to Win
Fair Value:US$15082.3% undervalued
61 followersusers have followed this narrative
3 commentsusers have commented on this narrative
0 likesusers have liked this narrative
RE

RedhawkCC on Prime Medicine ·
PRME remains a long shot but publication in the New England Journal of Medicine helps.
Fair Value:US$0.0469.0k% overvalued
1 followerusers have followed this narrative
0 commentsusers have commented on this narrative
0 likesusers have liked this narrative
Popular Narratives
TH


TheWallstreetKing on MicroVision ·
MicroVision will explode future revenue by 380.37% with a vision towards success
Fair Value:US$6098.4% undervalued
118 followersusers have followed this narrative
11 commentsusers have commented on this narrative
22 likesusers have liked this narrative
AN


AnalystConsensusTarget on NVIDIA ·
NVDA: Expanding AI Demand Will Drive Major Data Center Investments Through 2026
Fair Value:US$250.3926.1% undervalued
962 followersusers have followed this narrative
6 commentsusers have commented on this narrative
25 likesusers have liked this narrative
RO


RockeTeller on Santacruz Silver Mining ·
Crazy Undervalued 42 Baggers Silver Play (Active & Running Mine)
Fair Value:CA$8696.4% undervalued
75 followersusers have followed this narrative
7 commentsusers have commented on this narrative
21 likesusers have liked this narrative
