Stock Analysis
- United States
- /
- Chemicals
- /
- NYSE:MOS
The past one-year earnings decline for Mosaic (NYSE:MOS) likely explains shareholders long-term losses


The simplest way to benefit from a rising market is to buy an index fund. When you buy individual stocks, you can make higher profits, but you also face the risk of under-performance. That downside risk was realized by The Mosaic Company (NYSE:MOS) shareholders over the last year, as the share price declined 17%. That's disappointing when you consider the market returned 23%. At least the damage isn't so bad if you look at the last three years, since the stock is down 8.1% in that time. The falls have accelerated recently, with the share price down 11% in the last three months.
Although the past week has been more reassuring for shareholders, they're still in the red over the last year, so let's see if the underlying business has been responsible for the decline.
View our latest analysis for Mosaic
There is no denying that markets are sometimes efficient, but prices do not always reflect underlying business performance. One way to examine how market sentiment has changed over time is to look at the interaction between a company's share price and its earnings per share (EPS).
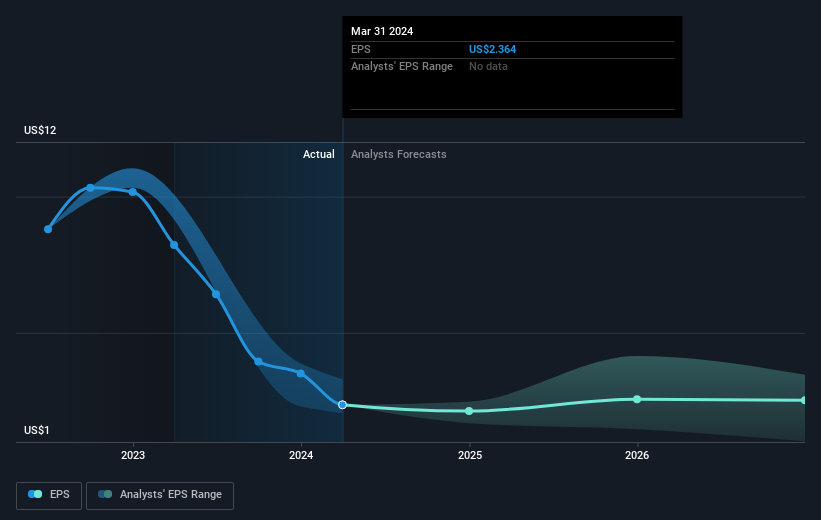
Unhappily, Mosaic had to report a 71% decline in EPS over the last year. The share price fall of 17% isn't as bad as the reduction in earnings per share. So despite the weak per-share profits, some investors are probably relieved the situation wasn't more difficult.
The company's earnings per share (over time) is depicted in the image below (click to see the exact numbers).
We're pleased to report that the CEO is remunerated more modestly than most CEOs at similarly capitalized companies. But while CEO remuneration is always worth checking, the really important question is whether the company can grow earnings going forward. Dive deeper into the earnings by checking this interactive graph of Mosaic's earnings, revenue and cash flow.
What About Dividends?
When looking at investment returns, it is important to consider the difference between total shareholder return (TSR) and share price return. The TSR incorporates the value of any spin-offs or discounted capital raisings, along with any dividends, based on the assumption that the dividends are reinvested. Arguably, the TSR gives a more comprehensive picture of the return generated by a stock. As it happens, Mosaic's TSR for the last 1 year was -15%, which exceeds the share price return mentioned earlier. This is largely a result of its dividend payments!
A Different Perspective
Mosaic shareholders are down 15% for the year (even including dividends), but the market itself is up 23%. Even the share prices of good stocks drop sometimes, but we want to see improvements in the fundamental metrics of a business, before getting too interested. On the bright side, long term shareholders have made money, with a gain of 5% per year over half a decade. It could be that the recent sell-off is an opportunity, so it may be worth checking the fundamental data for signs of a long term growth trend. I find it very interesting to look at share price over the long term as a proxy for business performance. But to truly gain insight, we need to consider other information, too. For example, we've discovered 2 warning signs for Mosaic that you should be aware of before investing here.
We will like Mosaic better if we see some big insider buys. While we wait, check out this free list of undervalued stocks (mostly small caps) with considerable, recent, insider buying.
Please note, the market returns quoted in this article reflect the market weighted average returns of stocks that currently trade on American exchanges.
Valuation is complex, but we're helping make it simple.
Find out whether Mosaic is potentially over or undervalued by checking out our comprehensive analysis, which includes fair value estimates, risks and warnings, dividends, insider transactions and financial health.
View the Free AnalysisHave feedback on this article? Concerned about the content? Get in touch with us directly. Alternatively, email editorial-team (at) simplywallst.com.
This article by Simply Wall St is general in nature. We provide commentary based on historical data and analyst forecasts only using an unbiased methodology and our articles are not intended to be financial advice. It does not constitute a recommendation to buy or sell any stock, and does not take account of your objectives, or your financial situation. We aim to bring you long-term focused analysis driven by fundamental data. Note that our analysis may not factor in the latest price-sensitive company announcements or qualitative material. Simply Wall St has no position in any stocks mentioned.
Valuation is complex, but we're helping make it simple.
Find out whether Mosaic is potentially over or undervalued by checking out our comprehensive analysis, which includes fair value estimates, risks and warnings, dividends, insider transactions and financial health.
View the Free AnalysisHave feedback on this article? Concerned about the content? Get in touch with us directly. Alternatively, email editorial-team@simplywallst.com
About NYSE:MOS
Mosaic
Through its subsidiaries, produces and markets concentrated phosphate and potash crop nutrients in North America and internationally.
Undervalued with excellent balance sheet.
