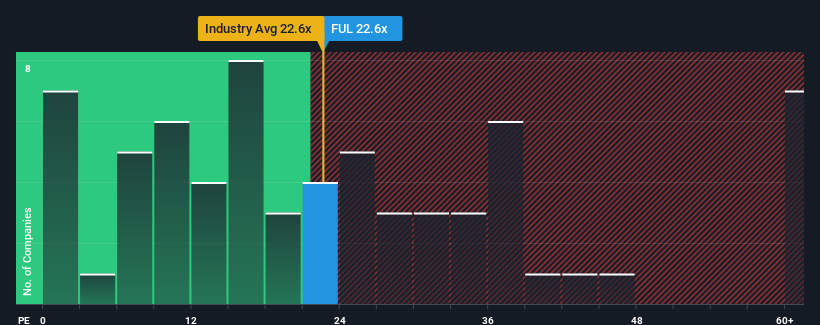
With a price-to-earnings (or "P/E") ratio of 22.6x H.B. Fuller Company (NYSE:FUL) may be sending bearish signals at the moment, given that almost half of all companies in the United States have P/E ratios under 19x and even P/E's lower than 11x are not unusual. Nonetheless, we'd need to dig a little deeper to determine if there is a rational basis for the elevated P/E.
With earnings growth that's superior to most other companies of late, H.B. Fuller has been doing relatively well. It seems that many are expecting the strong earnings performance to persist, which has raised the P/E. You'd really hope so, otherwise you're paying a pretty hefty price for no particular reason.
View our latest analysis for H.B. Fuller

Is There Enough Growth For H.B. Fuller?
There's an inherent assumption that a company should outperform the market for P/E ratios like H.B. Fuller's to be considered reasonable.
Taking a look back first, we see that the company grew earnings per share by an impressive 22% last year. The latest three year period has also seen a 17% overall rise in EPS, aided extensively by its short-term performance. Accordingly, shareholders would have probably been satisfied with the medium-term rates of earnings growth.
Shifting to the future, estimates from the five analysts covering the company suggest earnings should grow by 17% over the next year. Meanwhile, the rest of the market is forecast to expand by 15%, which is not materially different.
With this information, we find it interesting that H.B. Fuller is trading at a high P/E compared to the market. Apparently many investors in the company are more bullish than analysts indicate and aren't willing to let go of their stock right now. Although, additional gains will be difficult to achieve as this level of earnings growth is likely to weigh down the share price eventually.
What We Can Learn From H.B. Fuller's P/E?
It's argued the price-to-earnings ratio is an inferior measure of value within certain industries, but it can be a powerful business sentiment indicator.
Our examination of H.B. Fuller's analyst forecasts revealed that its market-matching earnings outlook isn't impacting its high P/E as much as we would have predicted. Right now we are uncomfortable with the relatively high share price as the predicted future earnings aren't likely to support such positive sentiment for long. Unless these conditions improve, it's challenging to accept these prices as being reasonable.
Don't forget that there may be other risks. For instance, we've identified 1 warning sign for H.B. Fuller that you should be aware of.
You might be able to find a better investment than H.B. Fuller. If you want a selection of possible candidates, check out this free list of interesting companies that trade on a low P/E (but have proven they can grow earnings).
Valuation is complex, but we're here to simplify it.
Discover if H.B. Fuller might be undervalued or overvalued with our detailed analysis, featuring fair value estimates, potential risks, dividends, insider trades, and its financial condition.
Access Free AnalysisHave feedback on this article? Concerned about the content? Get in touch with us directly. Alternatively, email editorial-team (at) simplywallst.com.
This article by Simply Wall St is general in nature. We provide commentary based on historical data and analyst forecasts only using an unbiased methodology and our articles are not intended to be financial advice. It does not constitute a recommendation to buy or sell any stock, and does not take account of your objectives, or your financial situation. We aim to bring you long-term focused analysis driven by fundamental data. Note that our analysis may not factor in the latest price-sensitive company announcements or qualitative material. Simply Wall St has no position in any stocks mentioned.
About NYSE:FUL
H.B. Fuller
H.B. Fuller Company, together with its subsidiaries, formulates, manufactures, and markets adhesives, sealants, coatings, polymers, tapes, encapsulants, additives, and other specialty chemical products.
Established dividend payer with moderate growth potential.
Similar Companies
Market Insights
Community Narratives


