- United States
- /
- Chemicals
- /
- NYSE:CF
CF Industries Holdings' (NYSE:CF) 17% CAGR outpaced the company's earnings growth over the same five-year period


These days it's easy to simply buy an index fund, and your returns should (roughly) match the market. But the truth is, you can make significant gains if you buy good quality businesses at the right price. For example, the CF Industries Holdings, Inc. (NYSE:CF) share price is up 95% in the last five years, slightly above the market return. Zooming in, the stock is up a respectable 16% in the last year.
On the back of a solid 7-day performance, let's check what role the company's fundamentals have played in driving long term shareholder returns.
See our latest analysis for CF Industries Holdings
In his essay The Superinvestors of Graham-and-Doddsville Warren Buffett described how share prices do not always rationally reflect the value of a business. One way to examine how market sentiment has changed over time is to look at the interaction between a company's share price and its earnings per share (EPS).
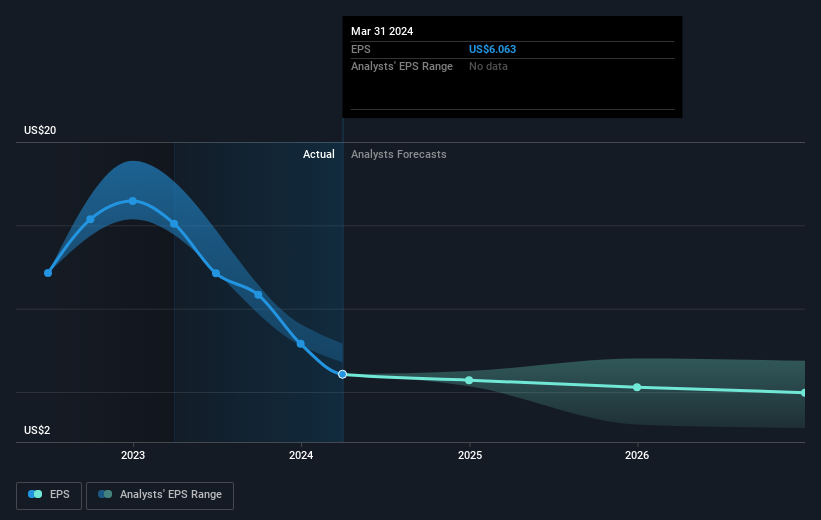
During five years of share price growth, CF Industries Holdings achieved compound earnings per share (EPS) growth of 36% per year. This EPS growth is higher than the 14% average annual increase in the share price. So one could conclude that the broader market has become more cautious towards the stock.
The graphic below depicts how EPS has changed over time (unveil the exact values by clicking on the image).
We know that CF Industries Holdings has improved its bottom line over the last three years, but what does the future have in store? You can see how its balance sheet has strengthened (or weakened) over time in this free interactive graphic.
What About Dividends?
As well as measuring the share price return, investors should also consider the total shareholder return (TSR). Whereas the share price return only reflects the change in the share price, the TSR includes the value of dividends (assuming they were reinvested) and the benefit of any discounted capital raising or spin-off. So for companies that pay a generous dividend, the TSR is often a lot higher than the share price return. As it happens, CF Industries Holdings' TSR for the last 5 years was 121%, which exceeds the share price return mentioned earlier. The dividends paid by the company have thusly boosted the total shareholder return.
A Different Perspective
CF Industries Holdings shareholders are up 19% for the year (even including dividends). Unfortunately this falls short of the market return. On the bright side, that's still a gain, and it's actually better than the average return of 17% over half a decade It is possible that returns will improve along with the business fundamentals. It's always interesting to track share price performance over the longer term. But to understand CF Industries Holdings better, we need to consider many other factors. To that end, you should learn about the 3 warning signs we've spotted with CF Industries Holdings (including 1 which makes us a bit uncomfortable) .
For those who like to find winning investments this free list of undervalued companies with recent insider purchasing, could be just the ticket.
Please note, the market returns quoted in this article reflect the market weighted average returns of stocks that currently trade on American exchanges.
New: AI Stock Screener & Alerts
Our new AI Stock Screener scans the market every day to uncover opportunities.
• Dividend Powerhouses (3%+ Yield)
• Undervalued Small Caps with Insider Buying
• High growth Tech and AI Companies
Or build your own from over 50 metrics.
Have feedback on this article? Concerned about the content? Get in touch with us directly. Alternatively, email editorial-team (at) simplywallst.com.
This article by Simply Wall St is general in nature. We provide commentary based on historical data and analyst forecasts only using an unbiased methodology and our articles are not intended to be financial advice. It does not constitute a recommendation to buy or sell any stock, and does not take account of your objectives, or your financial situation. We aim to bring you long-term focused analysis driven by fundamental data. Note that our analysis may not factor in the latest price-sensitive company announcements or qualitative material. Simply Wall St has no position in any stocks mentioned.
About NYSE:CF
CF Industries Holdings
Engages in the manufacture and sale of hydrogen and nitrogen products for energy, fertilizer, emissions abatement, and other industrial activities in North America, Europe, and internationally.
Excellent balance sheet established dividend payer.

