- United States
- /
- Packaging
- /
- NYSE:BALL
Ball Corporation's (NYSE:BALL) Intrinsic Value Is Potentially 57% Above Its Share Price

Key Insights
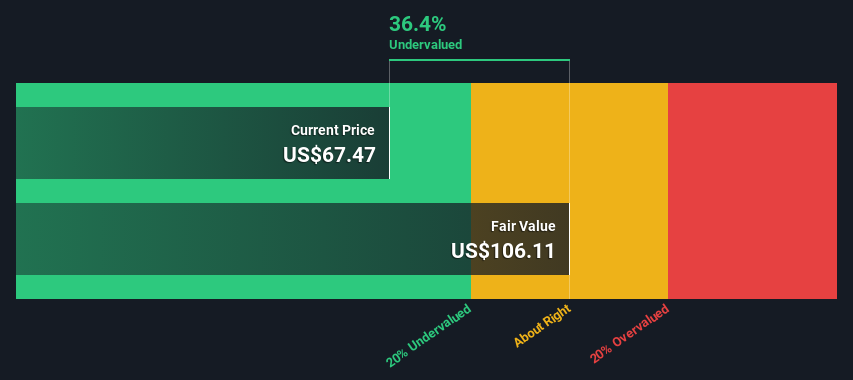
- Ball's estimated fair value is US$106 based on 2 Stage Free Cash Flow to Equity
- Ball's US$67.47 share price signals that it might be 36% undervalued
- The US$71.12 analyst price target for BALL is 33% less than our estimate of fair value
How far off is Ball Corporation (NYSE:BALL) from its intrinsic value? Using the most recent financial data, we'll take a look at whether the stock is fairly priced by taking the forecast future cash flows of the company and discounting them back to today's value. One way to achieve this is by employing the Discounted Cash Flow (DCF) model. Models like these may appear beyond the comprehension of a lay person, but they're fairly easy to follow.
Companies can be valued in a lot of ways, so we would point out that a DCF is not perfect for every situation. For those who are keen learners of equity analysis, the Simply Wall St analysis model here may be something of interest to you.
See our latest analysis for Ball
What's The Estimated Valuation?
We're using the 2-stage growth model, which simply means we take in account two stages of company's growth. In the initial period the company may have a higher growth rate and the second stage is usually assumed to have a stable growth rate. To start off with, we need to estimate the next ten years of cash flows. Where possible we use analyst estimates, but when these aren't available we extrapolate the previous free cash flow (FCF) from the last estimate or reported value. We assume companies with shrinking free cash flow will slow their rate of shrinkage, and that companies with growing free cash flow will see their growth rate slow, over this period. We do this to reflect that growth tends to slow more in the early years than it does in later years.
A DCF is all about the idea that a dollar in the future is less valuable than a dollar today, so we discount the value of these future cash flows to their estimated value in today's dollars:
10-year free cash flow (FCF) forecast
| 2025 | 2026 | 2027 | 2028 | 2029 | 2030 | 2031 | 2032 | 2033 | 2034 | |
| Levered FCF ($, Millions) | US$994.2m | US$1.08b | US$1.15b | US$1.21b | US$1.27b | US$1.32b | US$1.36b | US$1.40b | US$1.45b | US$1.49b |
| Growth Rate Estimate Source | Analyst x5 | Analyst x4 | Est @ 6.36% | Est @ 5.21% | Est @ 4.39% | Est @ 3.83% | Est @ 3.43% | Est @ 3.15% | Est @ 2.95% | Est @ 2.82% |
| Present Value ($, Millions) Discounted @ 6.1% | US$937 | US$963 | US$965 | US$957 | US$941 | US$920 | US$897 | US$872 | US$846 | US$819 |
("Est" = FCF growth rate estimated by Simply Wall St)
Present Value of 10-year Cash Flow (PVCF) = US$9.1b
We now need to calculate the Terminal Value, which accounts for all the future cash flows after this ten year period. The Gordon Growth formula is used to calculate Terminal Value at a future annual growth rate equal to the 5-year average of the 10-year government bond yield of 2.5%. We discount the terminal cash flows to today's value at a cost of equity of 6.1%.
Terminal Value (TV)= FCF2034 × (1 + g) ÷ (r – g) = US$1.5b× (1 + 2.5%) ÷ (6.1%– 2.5%) = US$42b
Present Value of Terminal Value (PVTV)= TV / (1 + r)10= US$42b÷ ( 1 + 6.1%)10= US$23b
The total value, or equity value, is then the sum of the present value of the future cash flows, which in this case is US$32b. In the final step we divide the equity value by the number of shares outstanding. Relative to the current share price of US$67.5, the company appears quite undervalued at a 36% discount to where the stock price trades currently. Valuations are imprecise instruments though, rather like a telescope - move a few degrees and end up in a different galaxy. Do keep this in mind.
The Assumptions
The calculation above is very dependent on two assumptions. The first is the discount rate and the other is the cash flows. Part of investing is coming up with your own evaluation of a company's future performance, so try the calculation yourself and check your own assumptions. The DCF also does not consider the possible cyclicality of an industry, or a company's future capital requirements, so it does not give a full picture of a company's potential performance. Given that we are looking at Ball as potential shareholders, the cost of equity is used as the discount rate, rather than the cost of capital (or weighted average cost of capital, WACC) which accounts for debt. In this calculation we've used 6.1%, which is based on a levered beta of 0.882. Beta is a measure of a stock's volatility, compared to the market as a whole. We get our beta from the industry average beta of globally comparable companies, with an imposed limit between 0.8 and 2.0, which is a reasonable range for a stable business.
SWOT Analysis for Ball
- Debt is well covered by earnings.
- Earnings declined over the past year.
- Dividend is low compared to the top 25% of dividend payers in the Packaging market.
- Trading below our estimate of fair value by more than 20%.
- Debt is not well covered by operating cash flow.
- Paying a dividend but company has no free cash flows.
- Annual earnings are forecast to decline for the next 3 years.
Moving On:
Although the valuation of a company is important, it is only one of many factors that you need to assess for a company. The DCF model is not a perfect stock valuation tool. Instead the best use for a DCF model is to test certain assumptions and theories to see if they would lead to the company being undervalued or overvalued. For instance, if the terminal value growth rate is adjusted slightly, it can dramatically alter the overall result. What is the reason for the share price sitting below the intrinsic value? For Ball, we've compiled three fundamental elements you should assess:
- Risks: To that end, you should learn about the 3 warning signs we've spotted with Ball (including 2 which are potentially serious) .
- Future Earnings: How does BALL's growth rate compare to its peers and the wider market? Dig deeper into the analyst consensus number for the upcoming years by interacting with our free analyst growth expectation chart.
- Other High Quality Alternatives: Do you like a good all-rounder? Explore our interactive list of high quality stocks to get an idea of what else is out there you may be missing!
PS. Simply Wall St updates its DCF calculation for every American stock every day, so if you want to find the intrinsic value of any other stock just search here.
Valuation is complex, but we're here to simplify it.
Discover if Ball might be undervalued or overvalued with our detailed analysis, featuring fair value estimates, potential risks, dividends, insider trades, and its financial condition.
Access Free AnalysisHave feedback on this article? Concerned about the content? Get in touch with us directly. Alternatively, email editorial-team (at) simplywallst.com.
This article by Simply Wall St is general in nature. We provide commentary based on historical data and analyst forecasts only using an unbiased methodology and our articles are not intended to be financial advice. It does not constitute a recommendation to buy or sell any stock, and does not take account of your objectives, or your financial situation. We aim to bring you long-term focused analysis driven by fundamental data. Note that our analysis may not factor in the latest price-sensitive company announcements or qualitative material. Simply Wall St has no position in any stocks mentioned.
About NYSE:BALL
Ball
Supplies aluminum packaging products for the beverage, personal care, and household products industries in the United States, Brazil, and internationally.
Fair value with moderate growth potential.
Similar Companies
Market Insights

Community Narratives

