- United States
- /
- Metals and Mining
- /
- NasdaqCM:USAU
Here's Why We're Watching U.S. Gold's (NASDAQ:USAU) Cash Burn Situation


Even when a business is losing money, it's possible for shareholders to make money if they buy a good business at the right price. For example, although Amazon.com made losses for many years after listing, if you had bought and held the shares since 1999, you would have made a fortune. Nonetheless, only a fool would ignore the risk that a loss making company burns through its cash too quickly.
So should U.S. Gold (NASDAQ:USAU) shareholders be worried about its cash burn? For the purpose of this article, we'll define cash burn as the amount of cash the company is spending each year to fund its growth (also called its negative free cash flow). First, we'll determine its cash runway by comparing its cash burn with its cash reserves.
View our latest analysis for U.S. Gold
Does U.S. Gold Have A Long Cash Runway?
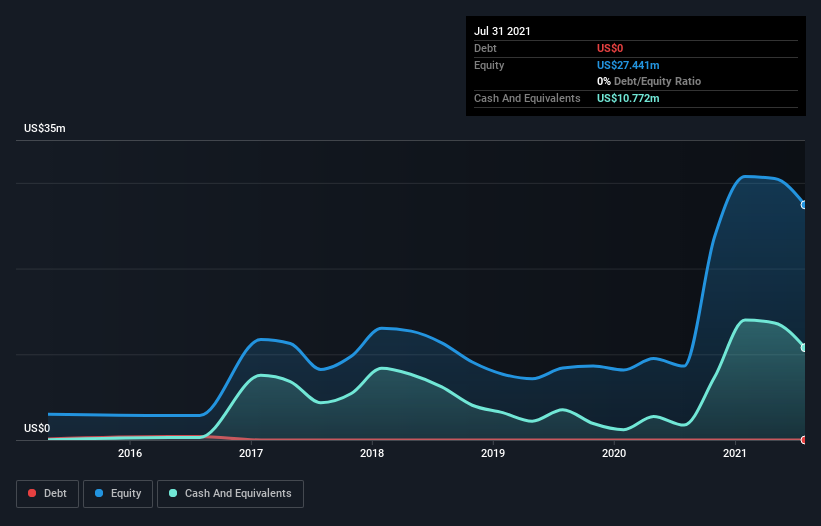
You can calculate a company's cash runway by dividing the amount of cash it has by the rate at which it is spending that cash. In July 2021, U.S. Gold had US$11m in cash, and was debt-free. In the last year, its cash burn was US$10m. Therefore, from July 2021 it had roughly 12 months of cash runway. That's not too bad, but it's fair to say the end of the cash runway is in sight, unless cash burn reduces drastically. Importantly, if we extrapolate recent cash burn trends, the cash runway would be a lot longer. The image below shows how its cash balance has been changing over the last few years.
How Is U.S. Gold's Cash Burn Changing Over Time?
U.S. Gold didn't record any revenue over the last year, indicating that it's an early stage company still developing its business. So while we can't look to sales to understand growth, we can look at how the cash burn is changing to understand how expenditure is trending over time. In fact, it ramped its spending strongly over the last year, increasing cash burn by 172%. It's fair to say that sort of rate of increase cannot be maintained for very long, without putting pressure on the balance sheet. Clearly, however, the crucial factor is whether the company will grow its business going forward. So you might want to take a peek at how much the company is expected to grow in the next few years.
Can U.S. Gold Raise More Cash Easily?
Given its cash burn trajectory, U.S. Gold shareholders may wish to consider how easily it could raise more cash, despite its solid cash runway. Generally speaking, a listed business can raise new cash through issuing shares or taking on debt. One of the main advantages held by publicly listed companies is that they can sell shares to investors to raise cash and fund growth. By comparing a company's annual cash burn to its total market capitalisation, we can estimate roughly how many shares it would have to issue in order to run the company for another year (at the same burn rate).
U.S. Gold has a market capitalisation of US$78m and burnt through US$10m last year, which is 13% of the company's market value. Given that situation, it's fair to say the company wouldn't have much trouble raising more cash for growth, but shareholders would be somewhat diluted.
How Risky Is U.S. Gold's Cash Burn Situation?
On this analysis of U.S. Gold's cash burn, we think its cash burn relative to its market cap was reassuring, while its increasing cash burn has us a bit worried. Summing up, we think the U.S. Gold's cash burn is a risk, based on the factors we mentioned in this article. Taking a deeper dive, we've spotted 4 warning signs for U.S. Gold you should be aware of, and 3 of them are significant.
Of course, you might find a fantastic investment by looking elsewhere. So take a peek at this free list of interesting companies, and this list of stocks growth stocks (according to analyst forecasts)
New: AI Stock Screener & Alerts
Our new AI Stock Screener scans the market every day to uncover opportunities.
• Dividend Powerhouses (3%+ Yield)
• Undervalued Small Caps with Insider Buying
• High growth Tech and AI Companies
Or build your own from over 50 metrics.
This article by Simply Wall St is general in nature. We provide commentary based on historical data and analyst forecasts only using an unbiased methodology and our articles are not intended to be financial advice. It does not constitute a recommendation to buy or sell any stock, and does not take account of your objectives, or your financial situation. We aim to bring you long-term focused analysis driven by fundamental data. Note that our analysis may not factor in the latest price-sensitive company announcements or qualitative material. Simply Wall St has no position in any stocks mentioned.
Have feedback on this article? Concerned about the content? Get in touch with us directly. Alternatively, email editorial-team (at) simplywallst.com.
About NasdaqCM:USAU
U.S. Gold
Engages in the exploration and development of gold and precious metals primarily in the United States.
Excellent balance sheet low.
Market Insights

Community Narratives


