
Advertisement
- United States
- /
- Metals and Mining
- /
- NasdaqGS:STLD
Is Steel Dynamics, Inc.'s (NASDAQ:STLD) Balance Sheet A Threat To Its Future?

Want to participate in a short research study? Help shape the future of investing tools and you could win a $250 gift card!
Mid-caps stocks, like Steel Dynamics, Inc. (NASDAQ:STLD) with a market capitalization of US$7.2b, aren’t the focus of most investors who prefer to direct their investments towards either large-cap or small-cap stocks. However, history shows that overlooked mid-cap companies have performed better on a risk-adjusted manner than the smaller and larger segment of the market. Let’s take a look at STLD’s debt concentration and assess their financial liquidity to get an idea of their ability to fund strategic acquisitions and grow through cyclical pressures. Don’t forget that this is a general and concentrated examination of Steel Dynamics’s financial health, so you should conduct further analysis into STLD here.
View our latest analysis for Steel Dynamics
Does STLD Produce Much Cash Relative To Its Debt?
STLD's debt level has been constant at around US$2.4b over the previous year – this includes long-term debt. At this constant level of debt, STLD currently has US$965m remaining in cash and short-term investments to keep the business going. Moreover, STLD has generated cash from operations of US$1.4b over the same time period, leading to an operating cash to total debt ratio of 58%, indicating that STLD’s debt is appropriately covered by operating cash.
Does STLD’s liquid assets cover its short-term commitments?
At the current liabilities level of US$1.0b, the company has been able to meet these commitments with a current assets level of US$4.0b, leading to a 4.02x current account ratio. The current ratio is calculated by dividing current assets by current liabilities. However, many consider a ratio above 3x to be high, although this is not necessarily a bad thing.
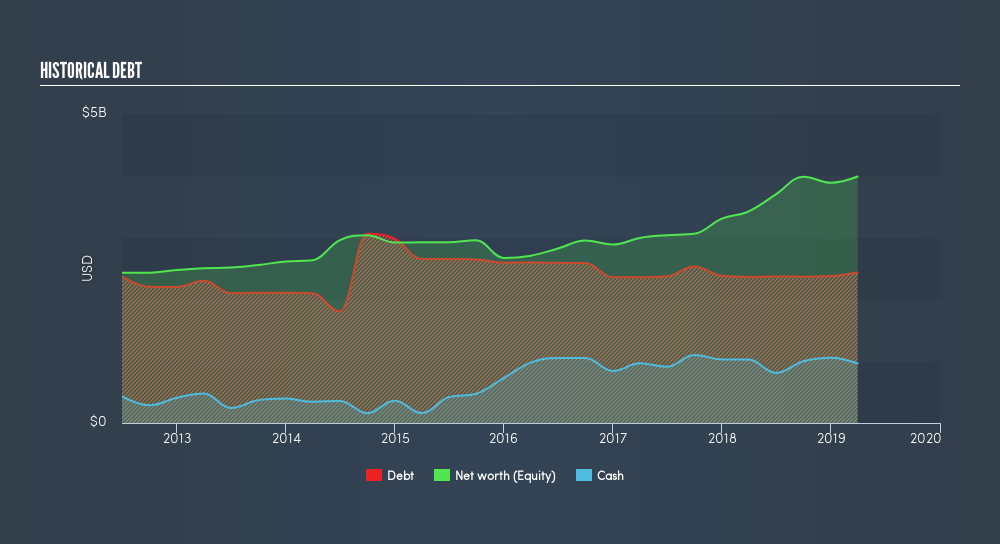
Does STLD face the risk of succumbing to its debt-load?
With debt reaching 61% of equity, STLD may be thought of as relatively highly levered. This is not unusual for mid-caps as debt tends to be a cheaper and faster source of funding for some businesses. We can check to see whether STLD is able to meet its debt obligations by looking at the net interest coverage ratio. A company generating earnings before interest and tax (EBIT) at least three times its net interest payments is considered financially sound. In STLD's, case, the ratio of 16.6x suggests that interest is comfortably covered, which means that lenders may be inclined to lend more money to the company, as it is seen as safe in terms of payback.
Next Steps:
STLD’s high cash coverage means that, although its debt levels are high, the company is able to utilise its borrowings efficiently in order to generate cash flow. Since there is also no concerns around STLD's liquidity needs, this may be its optimal capital structure for the time being. This is only a rough assessment of financial health, and I'm sure STLD has company-specific issues impacting its capital structure decisions. I recommend you continue to research Steel Dynamics to get a more holistic view of the mid-cap by looking at:
- Future Outlook: What are well-informed industry analysts predicting for STLD’s future growth? Take a look at our free research report of analyst consensus for STLD’s outlook.
- Valuation: What is STLD worth today? Is the stock undervalued, even when its growth outlook is factored into its intrinsic value? The intrinsic value infographic in our free research report helps visualize whether STLD is currently mispriced by the market.
- Other High-Performing Stocks: Are there other stocks that provide better prospects with proven track records? Explore our free list of these great stocks here.
We aim to bring you long-term focused research analysis driven by fundamental data. Note that our analysis may not factor in the latest price-sensitive company announcements or qualitative material.
If you spot an error that warrants correction, please contact the editor at editorial-team@simplywallst.com. This article by Simply Wall St is general in nature. It does not constitute a recommendation to buy or sell any stock, and does not take account of your objectives, or your financial situation. Simply Wall St has no position in the stocks mentioned. Thank you for reading.
About NasdaqGS:STLD
Steel Dynamics
Operates as a steel producer and metal recycler in the United States.
Flawless balance sheet, undervalued and pays a dividend.
Similar Companies
Market Insights


Advertisement
Community Narratives
The Future of Drug Testing? Fingerprint Tech Shows Serious Promise
Fair Value US$2.98|40.3% undervalued
JO
Community Contributor
Suncorp’s Next Chapter: Insurance-Only and Ready to Grow
Fair Value AU$22.83|7.6% undervalued
RO
Community Contributor
Thyssenkrupp Nucera Will Achieve Double-Digit Profits by 2030 Boosted by Hydrogen Growth
Fair Value €14.40|31.6% undervalued
CH
Community Contributor
Tesla’s Nvidia Moment – The AI & Robotics Inflection Point
Fair Value US$359.72|12.3% undervalued
BL
Community Contributor