Advertisement
- United States
- /
- Insurance
- /
- NYSE:MMC
Assessing Marsh & McLennan Stock After 19% Slide and Strong Risk Advisory Expansion

Simply Wall St
Reviewed by Bailey Pemberton
- If you are wondering whether Marsh & McLennan Companies is fairly priced or quietly offering value, you are not alone. This stock sits at the crossroads of quality and expectations.
- After rising 0.4% over the last week and 3.5% over the last month, the shares are still down 13.2% year to date and 18.9% over the past year, even though they are up 12.0% over 3 years and 70.3% over 5 years.
- Recent headlines have focused on Marsh & McLennan expanding its risk advisory capabilities and deepening its footprint in specialty insurance and consulting, reinforcing its position as a go to partner for complex corporate risks. This kind of steady strategic execution helps explain why the market can reassess the stock quickly when sentiment shifts.
- Right now, the company scores a 3/6 valuation check score, suggesting it screens as undervalued on half of the metrics we track, but not all of them. Next, we will walk through those valuation approaches in detail and wrap up with a more powerful way to think about what Marsh & McLennan is really worth.
Approach 1: Marsh & McLennan Companies Excess Returns Analysis
The Excess Returns model asks whether Marsh & McLennan Companies is generating returns on shareholders equity that are comfortably above its cost of capital, and what that gap is worth over time. It starts from the company book value per share and then estimates the value created by earning more than investors required return.
For Marsh & McLennan, the starting Book Value is $30.92 per share, with a Stable Book Value of $36.45 per share, based on weighted future estimates from four analysts. Against this equity base, the business is expected to deliver Stable EPS of $10.87 per share, implying an Average Return on Equity of 29.82%. With a Cost of Equity of only $2.54 per share, the model estimates Excess Return of $8.33 per share, meaning most of the forecast earnings are economic profit rather than just covering the capital charge.
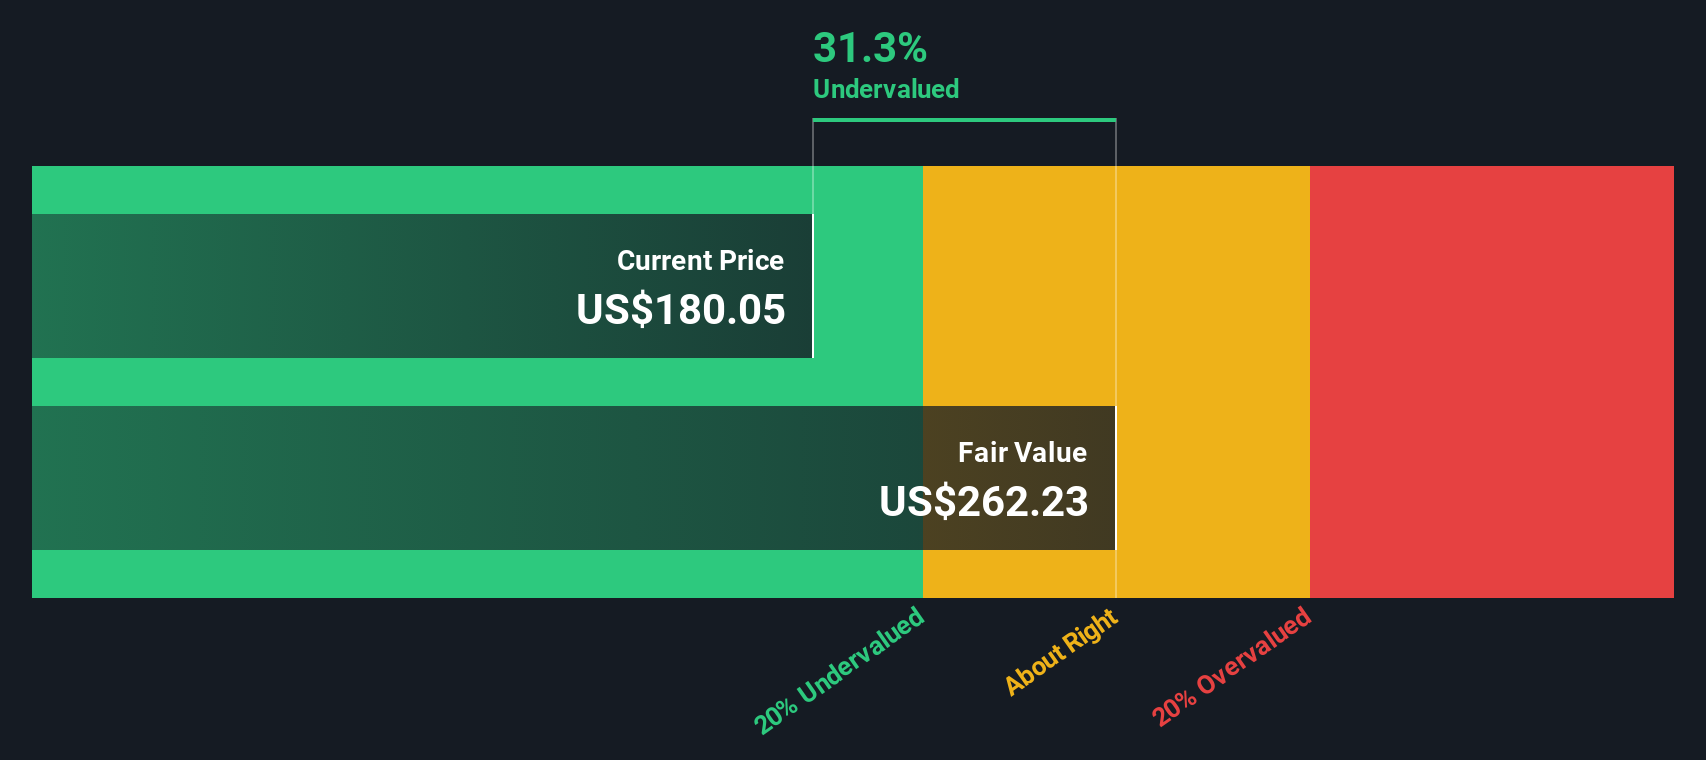
Aggregating these excess returns, the model arrives at an intrinsic value of roughly $261.90 per share, implying the stock is about 30.0% undervalued relative to its current trading price.
Result: UNDERVALUED
Our Excess Returns analysis suggests Marsh & McLennan Companies is undervalued by 30.0%. Track this in your watchlist or portfolio, or discover 933 more undervalued stocks based on cash flows.
Approach 2: Marsh & McLennan Companies Price vs Earnings
For established, consistently profitable businesses like Marsh & McLennan Companies, the price to earnings (PE) ratio is a useful shorthand for how much investors are willing to pay for each dollar of current earnings. It links today’s price directly to the company’s profit engine, which is ultimately what funds dividends, buybacks and reinvestment.
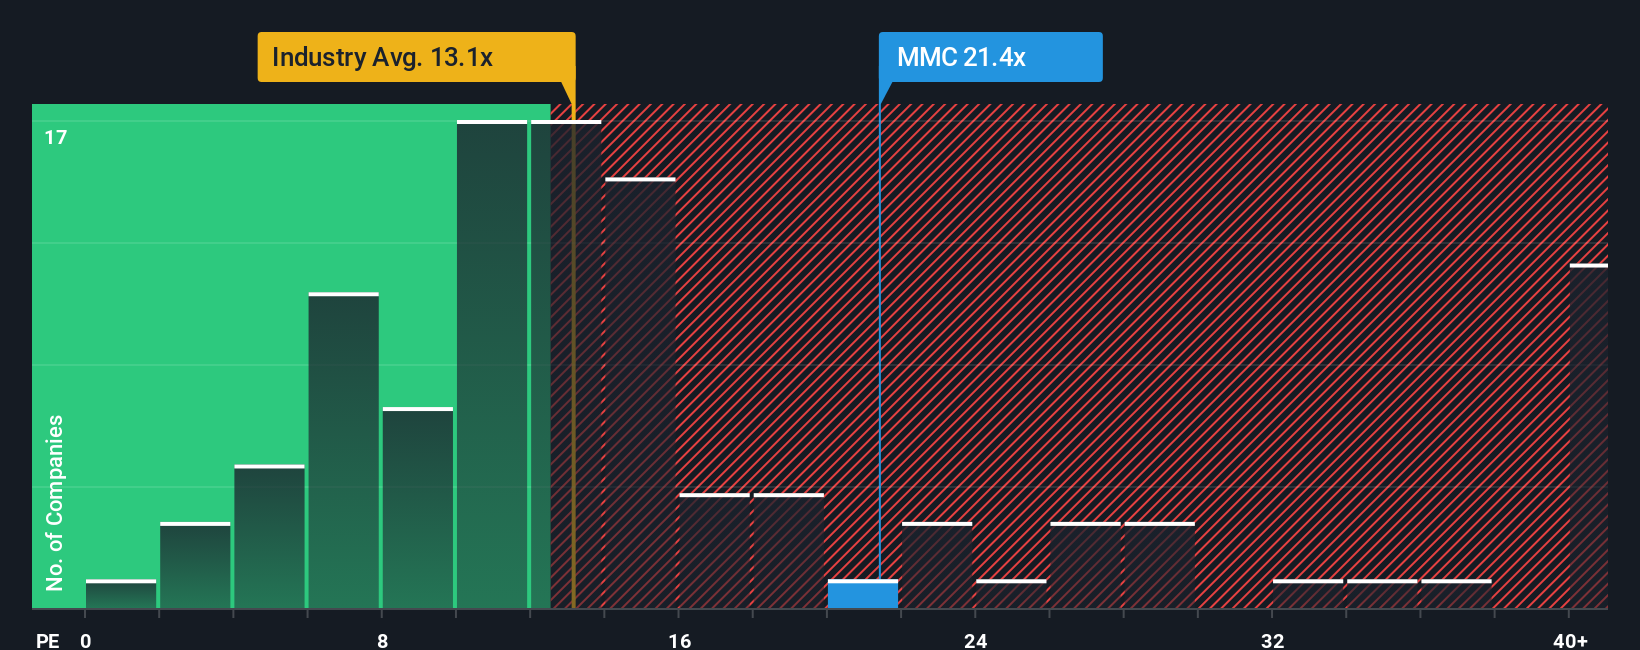
What counts as a normal or fair PE depends on how fast earnings are expected to grow and how risky those earnings are. Higher growth and more predictable cash flows usually justify a higher multiple, while slower or more volatile growth tends to pull the PE down. Marsh & McLennan currently trades on a PE of 21.77x, above the Insurance industry average of about 13.06x but below the peer group average of roughly 27.09x. This suggests the market already prices in some quality and growth, but not to the same extent as its closest comparables.
Simply Wall St’s fair ratio framework goes a step further. Instead of just comparing Marsh & McLennan with broad industry or peer averages, it estimates what a tailored PE should be once factors like the company-specific earnings growth outlook, profitability, risk profile, industry and market cap are all taken into account. For Marsh & McLennan, this fair ratio is 14.85x, well below the current 21.77x, implying the shares are pricing in more optimism than this fundamentals-based model supports.
Result: OVERVALUED
PE ratios tell one story, but what if the real opportunity lies elsewhere? Discover 1440 companies where insiders are betting big on explosive growth.
Upgrade Your Decision Making: Choose your Marsh & McLennan Companies Narrative
Earlier we mentioned that there is an even better way to understand valuation, so let us introduce you to Narratives, a simple framework on Simply Wall St’s Community page where you connect your view of a company’s story to your own forecast for its future revenue, earnings and margins, and then to a fair value you can compare with today’s share price. Instead of just accepting a PE ratio or analyst target, you can pick or build a Narrative that reflects how you think Marsh and McLennan will navigate rising risk complexity, regulation and digital disruption, and the platform turns that story into numbers that show whether the stock looks expensive or attractive. Narratives are dynamic, automatically updating when new earnings, news or guidance come in, so your fair value view evolves as the facts change. For example, one investor might back a more bullish Narrative that sees Marsh and McLennan compounding steadily and justifying a fair value closer to $258 per share. A more cautious investor could choose a Narrative aligned with a $197 view, and each can decide whether to buy, hold or sell based on how their chosen fair value compares with the current price.
Do you think there's more to the story for Marsh & McLennan Companies? Head over to our Community to see what others are saying!
This article by Simply Wall St is general in nature. We provide commentary based on historical data and analyst forecasts only using an unbiased methodology and our articles are not intended to be financial advice. It does not constitute a recommendation to buy or sell any stock, and does not take account of your objectives, or your financial situation. We aim to bring you long-term focused analysis driven by fundamental data. Note that our analysis may not factor in the latest price-sensitive company announcements or qualitative material. Simply Wall St has no position in any stocks mentioned.
New: Manage All Your Stock Portfolios in One Place
We've created the ultimate portfolio companion for stock investors, and it's free.
• Connect an unlimited number of Portfolios and see your total in one currency
• Be alerted to new Warning Signs or Risks via email or mobile
• Track the Fair Value of your stocks
Have feedback on this article? Concerned about the content? Get in touch with us directly. Alternatively, email editorial-team@simplywallst.com
About NYSE:MMC
Marsh & McLennan Companies
A professional services company, provides advisory services and insurance solutions to clients in the areas of risk, strategy, and people worldwide.
Excellent balance sheet established dividend payer.
Similar Companies
Market Insights

Advertisement
Weekly Picks
RO


RockeTeller on Santacruz Silver Mining ·
Crazy Undervalued 42 Baggers Silver Play (Active & Running Mine)
Fair Value:CA$8696.7% undervalued
10 followersusers have followed this narrative
5 commentsusers have commented on this narrative
0 likesusers have liked this narrative
RO


Robbo on Fiducian Group ·
Fiducian: Compliance Clouds or Value Opportunity?
Fair Value:AU$126.3% undervalued
1 followerusers have followed this narrative
0 commentsusers have commented on this narrative
0 likesusers have liked this narrative
WO

woodworthfund on Willamette Valley Vineyards ·
Willamette Valley Vineyards (WVVI): Not-So-Great Value
Fair Value:US$242.5% overvalued
2 followersusers have followed this narrative
0 commentsusers have commented on this narrative
1 likeusers have liked this narrative
Recently Updated Narratives
YE
Yellow_fever on China Starch Holdings ·
China Starch Holdings eyes a revenue growth of 4.66% with a 5-year strategic plan
Fair Value:HK$0.562.8% undervalued
1 followerusers have followed this narrative
0 commentsusers have commented on this narrative
0 likesusers have liked this narrative
CO

composite32 on Power Solutions International ·
PSIX The timing of insider sales is a serious question mark
Fair Value:US$37.3845.7% overvalued
1 followerusers have followed this narrative
0 commentsusers have commented on this narrative
0 likesusers have liked this narrative
TA


Talos on Marvell Technology ·
The Great Strategy Swap – Selling "Old Auto" to Buy "Future Light"
Fair Value:US$155.3740.2% undervalued
1 followerusers have followed this narrative
0 commentsusers have commented on this narrative
0 likesusers have liked this narrative
Popular Narratives
TH


TheWallstreetKing on MicroVision ·
MicroVision will explode future revenue by 380.37% with a vision towards success
Fair Value:US$6098.6% undervalued
112 followersusers have followed this narrative
11 commentsusers have commented on this narrative
22 likesusers have liked this narrative
AN


AnalystConsensusTarget on NVIDIA ·
NVDA: Expanding AI Demand Will Drive Major Data Center Investments Through 2026
Fair Value:US$250.3927.6% undervalued
947 followersusers have followed this narrative
6 commentsusers have commented on this narrative
24 likesusers have liked this narrative
OS


oscargarcia on Alphabet ·
The company that turned a verb into a global necessity and basically runs the modern internet, digital ads, smartphones, maps, and AI.
Fair Value:US$3407.2% undervalued
148 followersusers have followed this narrative
6 commentsusers have commented on this narrative
18 likesusers have liked this narrative
