- United States
- /
- Insurance
- /
- NYSE:HCI
Is It Too Late To Consider HCI Group After Its 2025 Surge And Tech Expansion?

Reviewed by Bailey Pemberton
- If you are wondering whether HCI Group is still a smart buy after its huge run up, or if you might be late to the party, this article will help you weigh what the current price really bakes in.
- The stock has climbed 1.1% over the last week, 9.4% over the last month, and a hefty 65.6% year to date. Longer term holders have seen 69.0% over 1 year, 405.4% over 3 years, and 305.1% over 5 years. This naturally raises questions about how much upside is left versus downside risk.
- Recent headlines have focused on HCI Group expanding its footprint in catastrophe exposed markets and continuing to refine its technology driven underwriting strategy. Both of these have helped shape investor expectations around profitability and resilience. At the same time, broader conversations about insurance pricing cycles and climate related risk have kept sentiment around property insurers like HCI Group particularly sensitive to perceived shifts in risk.
- Despite that backdrop, HCI Group currently scores a strong 6 out of 6 on our valuation checks for undervaluation, which is rare for a stock with this kind of track record. In a moment we will walk through the main valuation approaches behind that score, before finishing with a more nuanced way to think about the company’s true worth.
Approach 1: HCI Group Excess Returns Analysis
The Excess Returns model looks at how much profit HCI Group can generate above the return that shareholders reasonably demand, and then capitalizes those surplus profits into an intrinsic value per share.
Starting with a Book Value of $63.41 per share and an Average Return on Equity of 30.14%, the model derives a Stable EPS of $25.01 per share, based on the companys median ROE over the past 5 years. After subtracting a Cost of Equity of $5.77 per share, this leaves an Excess Return of $19.24 per share. This is then projected forward using a Stable Book Value of $83.00 per share from analyst estimates.
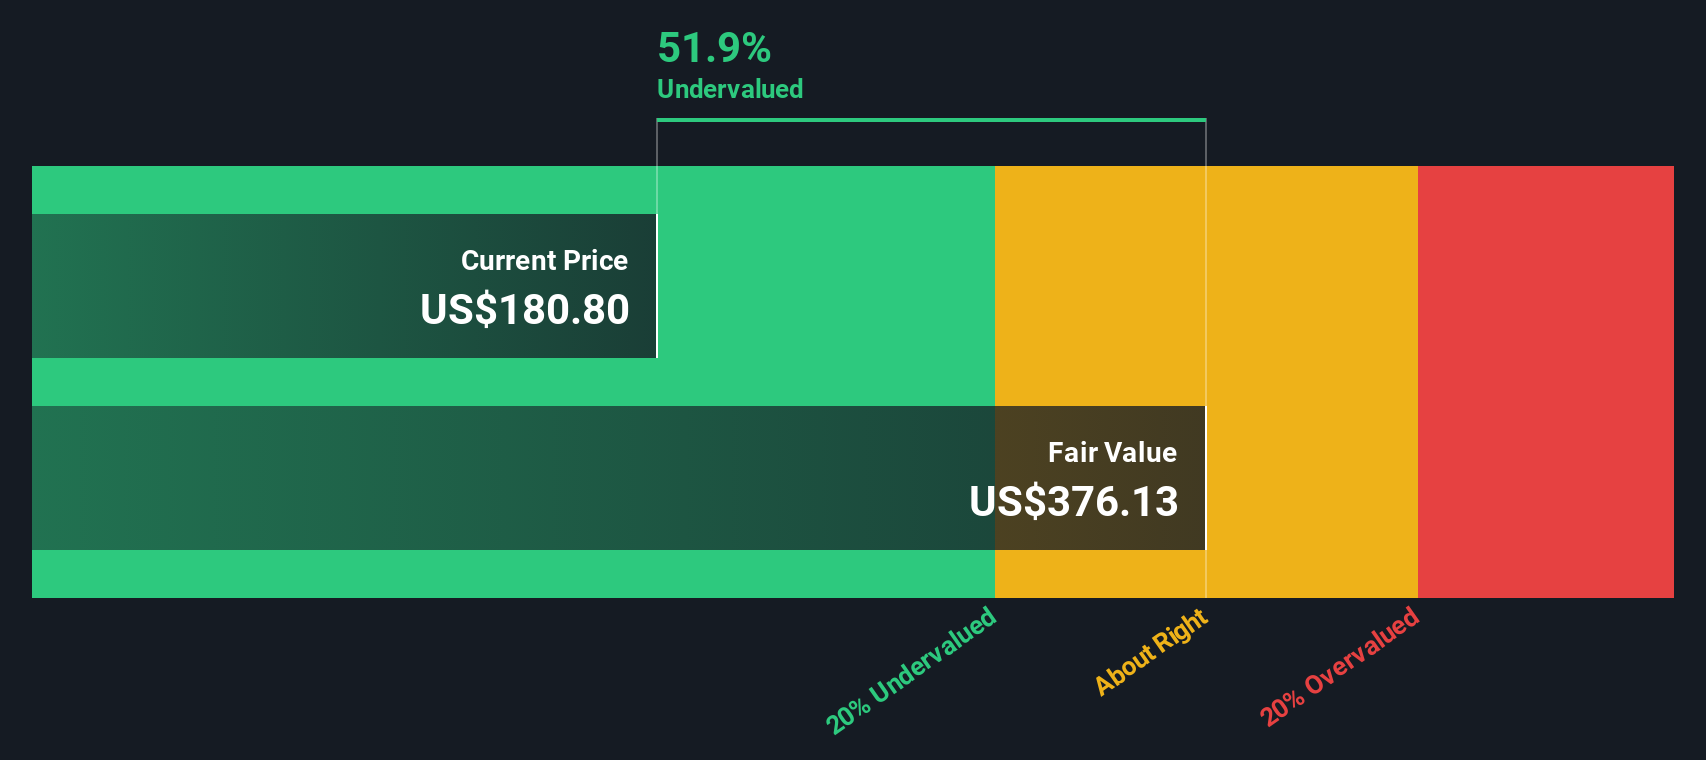
When these excess returns are aggregated, the Excess Returns model arrives at an intrinsic value of about $603.58 per share. Compared with the current share price, this implies the stock is roughly 68.6% undervalued, indicating that the market may be heavily discounting HCI Groups ability to sustain high returns on equity.
Result: UNDERVALUED
Our Excess Returns analysis suggests HCI Group is undervalued by 68.6%. Track this in your watchlist or portfolio, or discover 916 more undervalued stocks based on cash flows.
Approach 2: HCI Group Price vs Earnings
For profitable companies like HCI Group, the price to earnings, or PE, ratio is a useful snapshot of how much investors are willing to pay for each dollar of current earnings. It captures the market balance between what the business is earning today and what investors expect it to earn in the future.
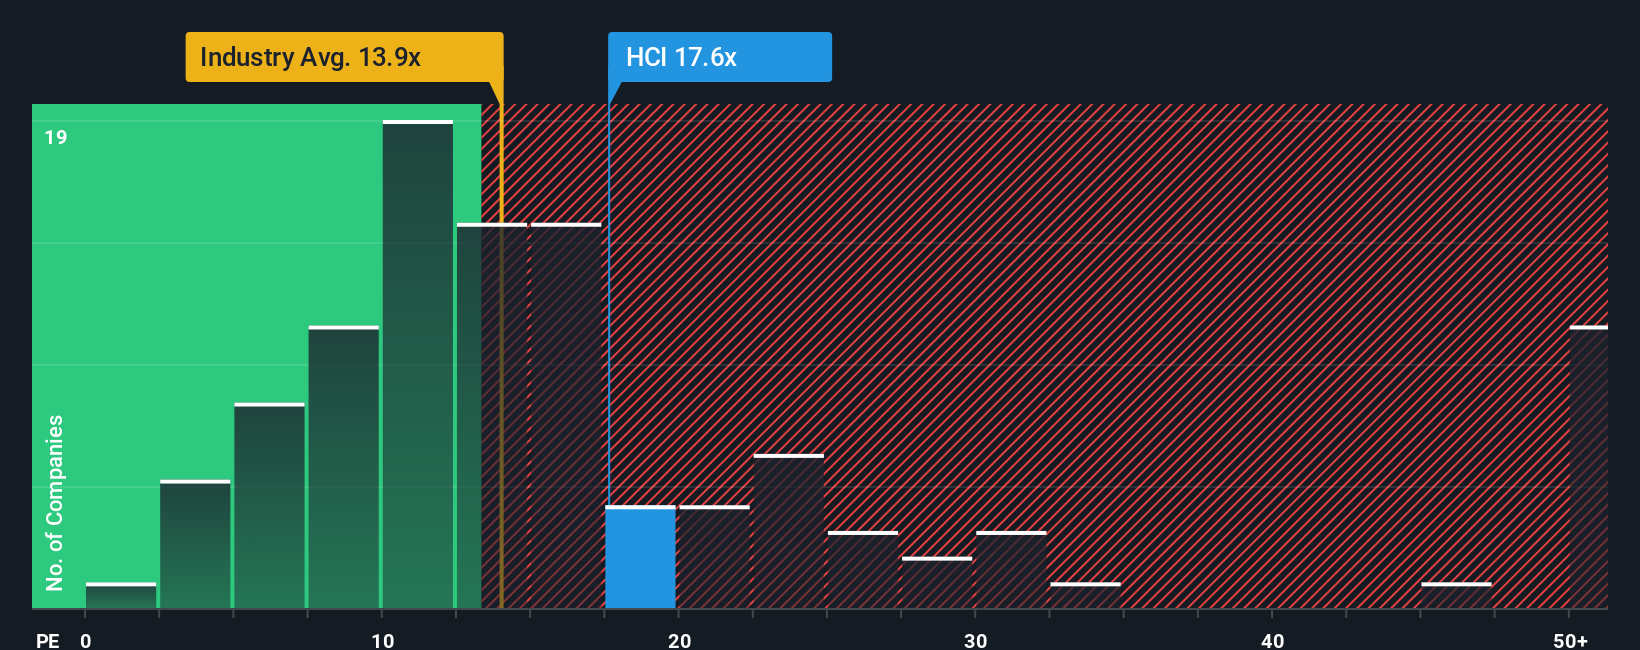
In general, faster growth and lower perceived risk justify a higher PE, while slower growth or higher risk tend to pull a normal or fair PE down. HCI Group currently trades on a PE of about 12.43x, which sits slightly below the Insurance industry average of around 13.49x and well below the broader peer group average of roughly 33.83x. That relative discount can hint at either a bargain or a market that is cautious about sustainability of earnings.
To refine this view, Simply Wall St calculates a Fair Ratio, which is the PE you would expect once you factor in HCI Group’s earnings growth profile, profitability, risk characteristics, industry and market cap. Because it blends these company specific drivers instead of relying only on blunt peer or industry comparisons, the Fair Ratio of about 13.30x offers a more tailored benchmark. With the actual PE near 12.43x, HCI Group appears modestly undervalued on this multiple based approach.
Result: UNDERVALUED
PE ratios tell one story, but what if the real opportunity lies elsewhere? Discover 1455 companies where insiders are betting big on explosive growth.
Upgrade Your Decision Making: Choose your HCI Group Narrative
Earlier we mentioned that there is an even better way to understand valuation, so let us introduce you to Narratives, a simple but powerful way to attach your story about HCI Group to the numbers you believe in, from future revenue and earnings to margins and fair value. A Narrative on Simply Wall St links three things together: the business story you believe, the financial forecast that flows from that story, and the fair value that forecast supports, all in one easy to use view on the Community page used by millions of investors. Narratives help clarify potential buy or sell decisions by showing you how your Fair Value compares to today’s Price, and they automatically update when new information like earnings, news, or guidance comes in. For example, one investor might build an optimistic HCI Group Narrative around sustained tech driven margin expansion and a Fair Value near 234 dollars per share, while a more cautious investor may focus on hurricane exposure and reinsurance costs, landing closer to 190 dollars. Narratives let you see, compare, and refine both perspectives in real time.
Do you think there's more to the story for HCI Group? Head over to our Community to see what others are saying!

This article by Simply Wall St is general in nature. We provide commentary based on historical data and analyst forecasts only using an unbiased methodology and our articles are not intended to be financial advice. It does not constitute a recommendation to buy or sell any stock, and does not take account of your objectives, or your financial situation. We aim to bring you long-term focused analysis driven by fundamental data. Note that our analysis may not factor in the latest price-sensitive company announcements or qualitative material. Simply Wall St has no position in any stocks mentioned.
Mobile Infrastructure for Defense and Disaster
The next wave in robotics isn't humanoid. Its fully autonomous towers delivering 5G, ISR, and radar in under 30 minutes, anywhere.
Get the investor briefing before the next round of contracts
Sponsored On Behalf of CiTechValuation is complex, but we're here to simplify it.
Discover if HCI Group might be undervalued or overvalued with our detailed analysis, featuring fair value estimates, potential risks, dividends, insider trades, and its financial condition.
Access Free AnalysisHave feedback on this article? Concerned about the content? Get in touch with us directly. Alternatively, email editorial-team@simplywallst.com
About NYSE:HCI
HCI Group
Engages in the property and casualty insurance, insurance management, reinsurance, real estate, and information technology businesses in the United States.
Very undervalued with flawless balance sheet and pays a dividend.
Similar Companies
Market Insights


Weekly Picks

Early mover in a fast growing industry. Likely to experience share price volatility as they scale


A case for CA$31.80 (undiluted), aka 8,616% upside from CA$0.37 (an 86 bagger!).


Moderation and Stabilisation: HOLD: Fair Price based on a 4-year Cycle is $12.08
Recently Updated Narratives


Title: Market Sentiment Is Dead Wrong — Here's Why PSEC Deserves a Second Look


An amazing opportunity to potentially get a 100 bagger

Amazon: Why the World’s Biggest Platform Still Runs on Invisible Economics
Popular Narratives


Crazy Undervalued 42 Baggers Silver Play (Active & Running Mine)


MicroVision will explode future revenue by 380.37% with a vision towards success


NVDA: Expanding AI Demand Will Drive Major Data Center Investments Through 2026
Trending Discussion
