Advertisement
- United States
- /
- Insurance
- /
- NYSE:GNW
How Genworth Is Priced After Recent Pullback and New Insurance Division Launch

Simply Wall St
Reviewed by Bailey Pemberton
Thinking about Genworth Financial? You are not alone. Investors have had this stock on their watchlists for years, and with good reason. Genworth's journey has been anything but dull, and the price chart is a testament to that. After steadily rising over the past five years, gaining an impressive 142.7%, the stock has rewarded patient shareholders. Year to date, it is up 22.1%, and if you zoom in a little closer, the last year brought another solid gain of 18.8%.
Of course, the short-term picture has been a bit bumpier. The last seven days saw a drop of 4.7%, and over the past month, shares have dipped by 0.4%. Some of this pullback reflects shifting sentiment across insurance and financial stocks as broader market volatility resurfaces. Yet, that long-term growth suggests plenty of investors still see potential in Genworth Financial’s evolving story.
When it comes to traditional valuation checks, though, Genworth doesn’t look like a classic bargain at this moment. Out of six key measures used to determine if a stock is undervalued, Genworth scores a zero. Not a single box is ticked for undervaluation. This does not mean the story ends here, however.
If you are wondering which valuation lenses experts use to analyze a stock like this, and more importantly, how these numbers might not be telling the whole story, keep reading. There may be a smarter way to understand Genworth’s value coming up.
Genworth Financial scores just 0/6 on our valuation checks. See what other red flags we found in the full valuation breakdown.
Approach 1: Genworth Financial Excess Returns Analysis
The Excess Returns valuation model is designed to assess how effectively a company generates returns above its cost of equity. Rather than focusing on pure cash flows or profits, it measures whether the company creates true economic value for shareholders considering what it costs to deploy capital.
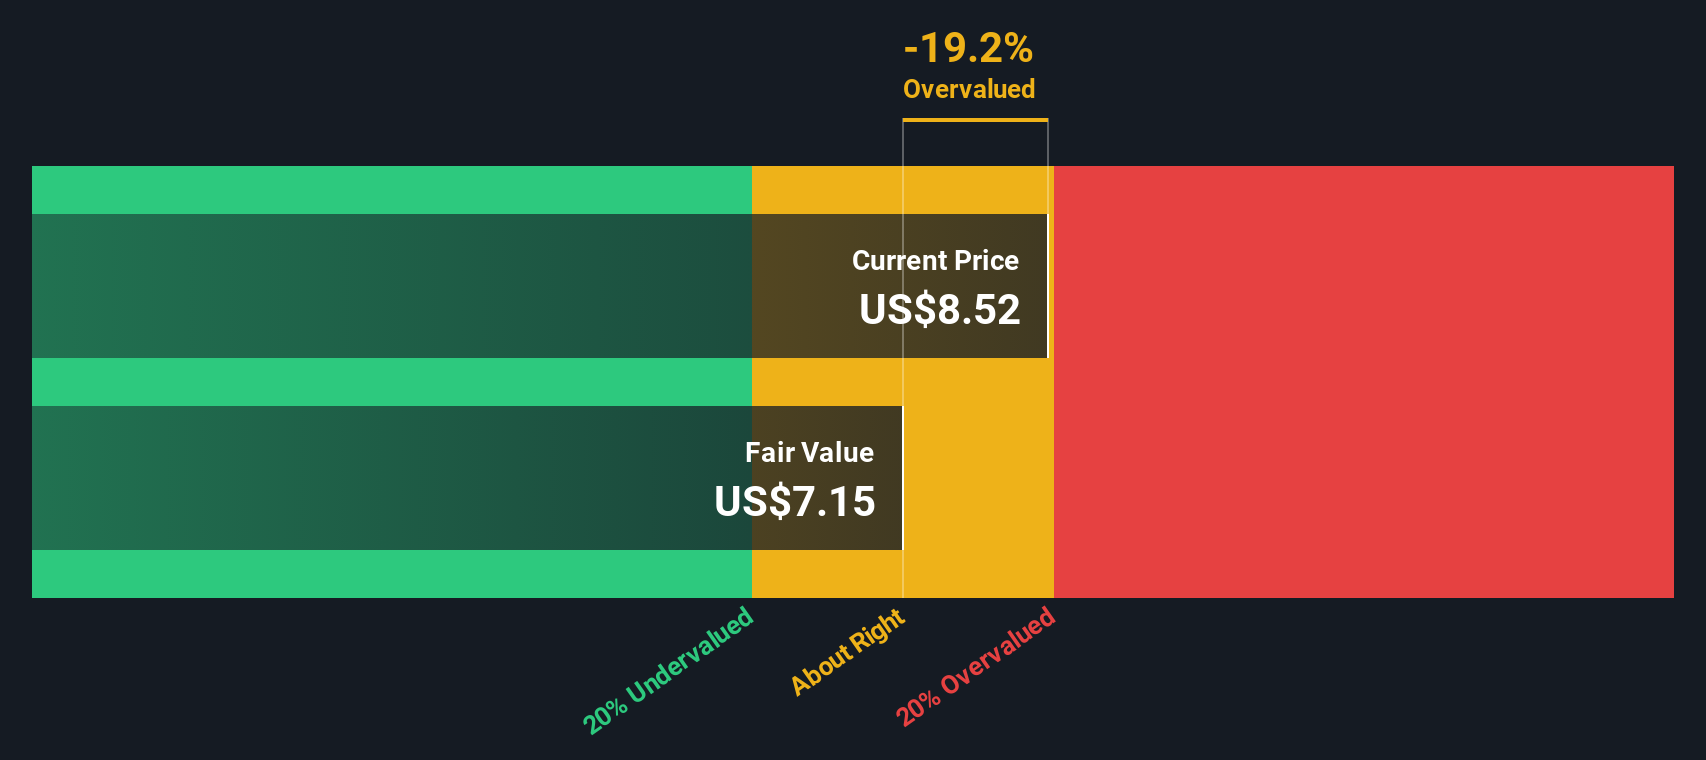
For Genworth Financial, the numbers tell a mixed story. The company’s book value stands at $21.35 per share, while its stable earnings per share (EPS) average $0.87, based on the typical return on equity over the last five years (a modest 4.72% annualized). However, the cost of equity is materially higher at $1.35 per share. This means the excess return, or what remains after covering the cost of capital, is negative at $-0.48 per share. In effect, capital employed by Genworth is not currently generating positive value above its required return.
Putting all these inputs together, the model estimates Genworth's intrinsic value at $7.15 per share. This is about 19.2% below the recent share price, indicating that the stock appears overvalued based on this method.
Result: OVERVALUED
Our Excess Returns analysis suggests Genworth Financial may be overvalued by 19.2%. Find undervalued stocks or create your own screener to find better value opportunities.
Approach 2: Genworth Financial Price vs Earnings
The price-to-earnings (PE) ratio is a widely used valuation metric for profitable companies like Genworth Financial because it directly relates the company’s market price to its ability to generate earnings. This makes it a clear way for investors to gauge what they are paying for each dollar of profit, especially when consistent earnings are present.
Deciding what counts as a fair PE ratio is a nuanced process. Generally, companies with stronger growth prospects and lower risk profiles justify higher PE ratios, as investors are willing to pay more today in anticipation of larger future profits. Conversely, higher perceived risk or sluggish growth often calls for a lower PE ratio.
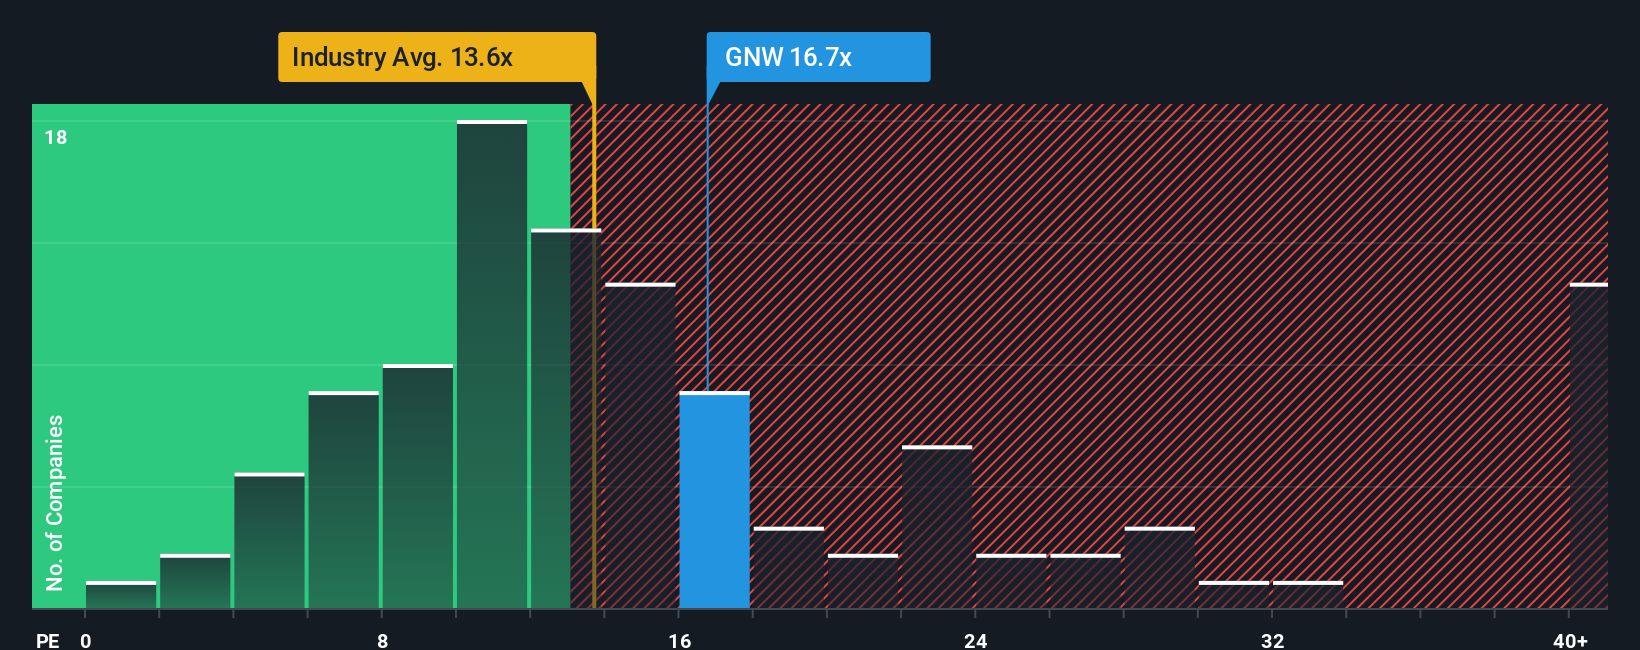
Genworth currently trades at a PE ratio of 16.7x, which sits above both the average among its peers (9.3x) and the insurance industry average (13.9x). On the surface, this premium might raise an eyebrow. However, Simply Wall St’s proprietary “Fair Ratio” model reframes the picture. The Fair Ratio adjusts for Genworth’s specific growth outlook, profit margin, industry, and other risk factors. This offers a data-driven target instead of a one-size-fits-all benchmark. This approach provides a more tailored valuation by ensuring the multiple is appropriate for Genworth's unique situation.
Comparing the actual PE of 16.7x to the Fair Ratio, which is within 0.10 points of the current level, suggests Genworth’s valuation looks about right at this time.
Result: ABOUT RIGHT
PE ratios tell one story, but what if the real opportunity lies elsewhere? Discover companies where insiders are betting big on explosive growth.
Upgrade Your Decision Making: Choose your Genworth Financial Narrative
Earlier we mentioned that there is an even better way to understand valuation, so let’s introduce you to Narratives. A Narrative is your personal story or perspective on a company, connecting the business’s journey to your own forecasts for its future revenue, earnings, and margins, and ultimately to what you believe is a fair value. Narratives bridge the gap between company news and numbers, letting you see exactly how your beliefs translate into a share price and investment decision.
On Simply Wall St’s Community page, millions of investors can easily create, share, or update their Narratives as new information comes in. This means your view of Genworth Financial’s value is always up to date, whether it is after a surprise earnings report or major company news. By comparing your calculated Fair Value to the current market price, Narratives help you decide if it is the right time to buy, hold, or sell.
For example, some investors might see Genworth’s Fair Value as high as $10.50 if they predict strong growth ahead, while others may estimate a more conservative $6.90 based on slower progress. Narratives allow you to clearly see these different viewpoints and make decisions that fit your own investment style.
Do you think there's more to the story for Genworth Financial? Create your own Narrative to let the Community know!
This article by Simply Wall St is general in nature. We provide commentary based on historical data and analyst forecasts only using an unbiased methodology and our articles are not intended to be financial advice. It does not constitute a recommendation to buy or sell any stock, and does not take account of your objectives, or your financial situation. We aim to bring you long-term focused analysis driven by fundamental data. Note that our analysis may not factor in the latest price-sensitive company announcements or qualitative material. Simply Wall St has no position in any stocks mentioned.
New: Manage All Your Stock Portfolios in One Place
We've created the ultimate portfolio companion for stock investors, and it's free.
• Connect an unlimited number of Portfolios and see your total in one currency
• Be alerted to new Warning Signs or Risks via email or mobile
• Track the Fair Value of your stocks
Have feedback on this article? Concerned about the content? Get in touch with us directly. Alternatively, email editorial-team@simplywallst.com
About NYSE:GNW
Genworth Financial
Provides mortgage and long-term care insurance products in the United States and internationally.
Proven track record with mediocre balance sheet.
Similar Companies
Market Insights

Advertisement
Community Narratives
A formidable player in AI and enterprise computing.
Fair Value US$210.00|12.2% overvalued
CO
Community Contributor
IREN's Bold Moves in Sustainable Bitcoin Mining & AI Data Centers
Fair Value US$72.52|17.1% undervalued
BL
Community Contributor
Cooling the Champions: The Aussie Tech Behind F1's Victories
Fair Value AU$12.40|38.7% undervalued
TR
Community Contributor