Advertisement
- United States
- /
- Insurance
- /
- NYSE:CB
Should Investors Reassess Chubb After Berkshire Hathaway Reveals Major Stake in 2025?

Simply Wall St
Reviewed by Bailey Pemberton
If you have Chubb stock in your portfolio, or you are thinking about buying in, you are not alone in weighing your next move. Over the past few years, this insurance giant has delivered powerful returns, climbing an impressive 162.1% over the last five years, with the three-year gain at 62.2%. Even in the shorter term, Chubb has shown solid momentum, up 5.4% year-to-date, and posting a 2.0% gain over the past week. That kind of resilience and growth has a lot of investors taking a closer look, especially as broader market shifts and sector trends push risk perceptions one way or another.
It is not just the share price that catches the eye. Chubb also stands out when we look at its valuation. Using a systematic, data-driven approach, Chubb earns a value score of 4 out of 6, indicating the company is undervalued in four different checks. That puts it in rare company among large insurers, especially with recent market developments fueling interest in financial sector stocks.
But how does this value score really stack up against the bigger picture? Before you decide what to do next, let us break down what goes into valuing Chubb. At the end, I will share an even better way to think about putting these numbers to work for your own portfolio.
Approach 1: Chubb Excess Returns Analysis
The Excess Returns valuation model measures how much profit a company generates over and above its cost of equity, providing an investor-focused lens on value creation. For Chubb, this approach puts a spotlight on how efficiently its management uses shareholder capital to drive intrinsic value.
Chubb’s latest figures stand out. The company’s Book Value is $174.07 per share, while its Stable Earnings Per Share (EPS) is $26.83, based on consensus future Return on Equity estimates from 11 analysts. With a Cost of Equity of $13.18 per share, Chubb is producing an Excess Return of $13.65 per share, clear evidence that it is generating profits well above its basic funding costs. The average Return on Equity is a solid 13.12%. Looking ahead, the Stable Book Value is projected to rise to $204.41 per share, signaling strength in Chubb’s capital base.
Using these metrics, the Excess Returns model calculates an intrinsic value of $609.63 per share. This figure is 52.9% above the current share price, meaning Chubb stock is significantly undervalued by this analysis.
Result: UNDERVALUED
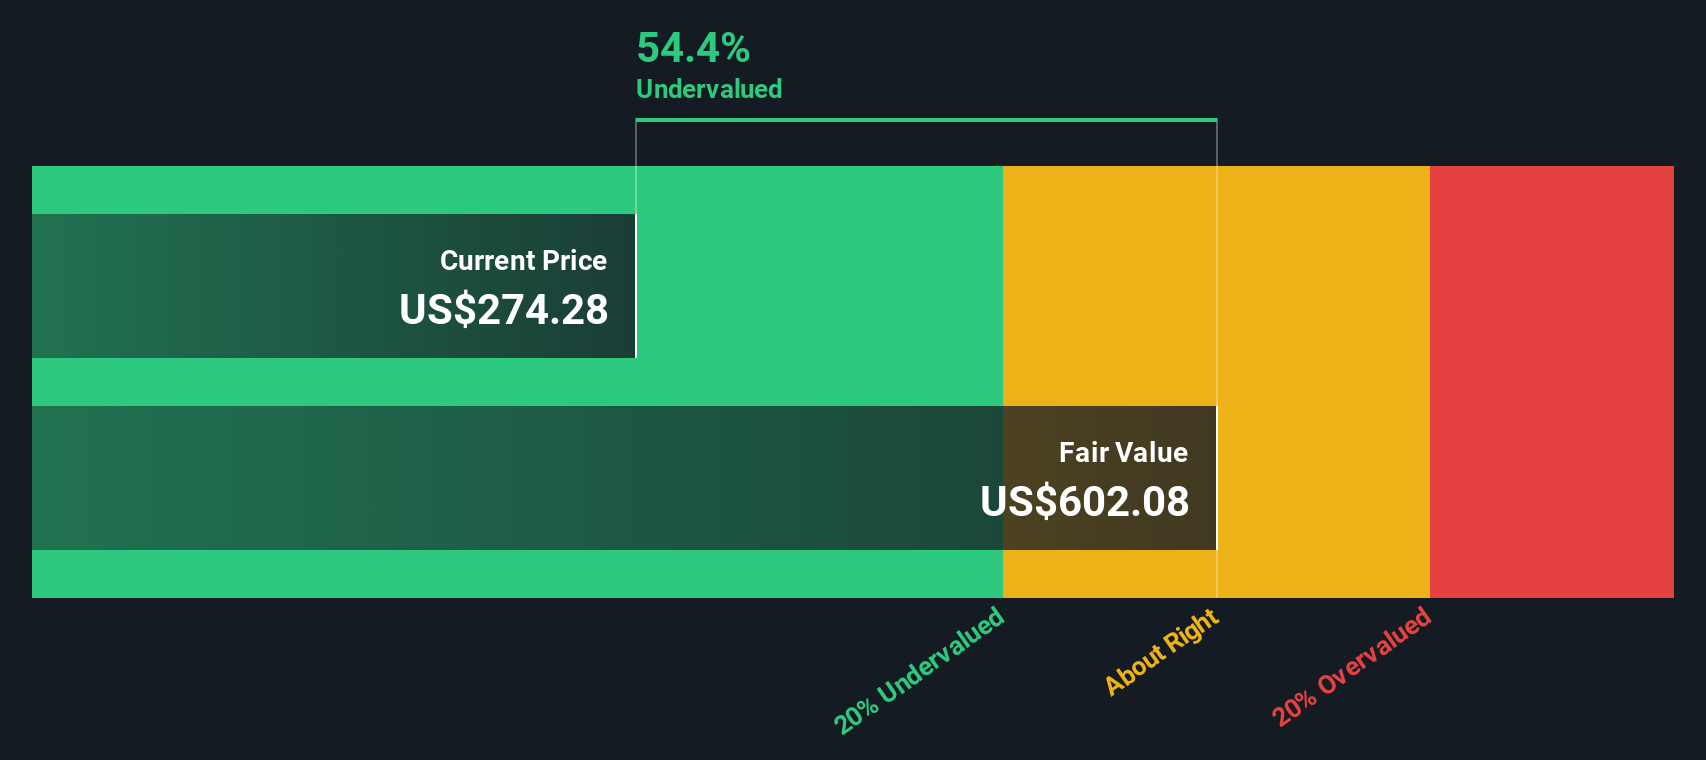
Our Excess Returns analysis suggests Chubb is undervalued by 52.9%. Track this in your watchlist or portfolio, or discover more undervalued stocks.
Approach 2: Chubb Price vs Earnings
For profitable companies like Chubb, the Price-to-Earnings (PE) ratio is a highly regarded metric for valuation. Since earnings ultimately drive shareholder returns, the PE ratio allows investors to quickly compare how much the market is willing to pay for each dollar of earnings. Of course, what constitutes a “fair” PE ratio depends on growth prospects and perceived risks. Faster earnings growth or lower risks usually justify higher multiples. In contrast, slow growth or extra risk tends to keep PE ratios lower.
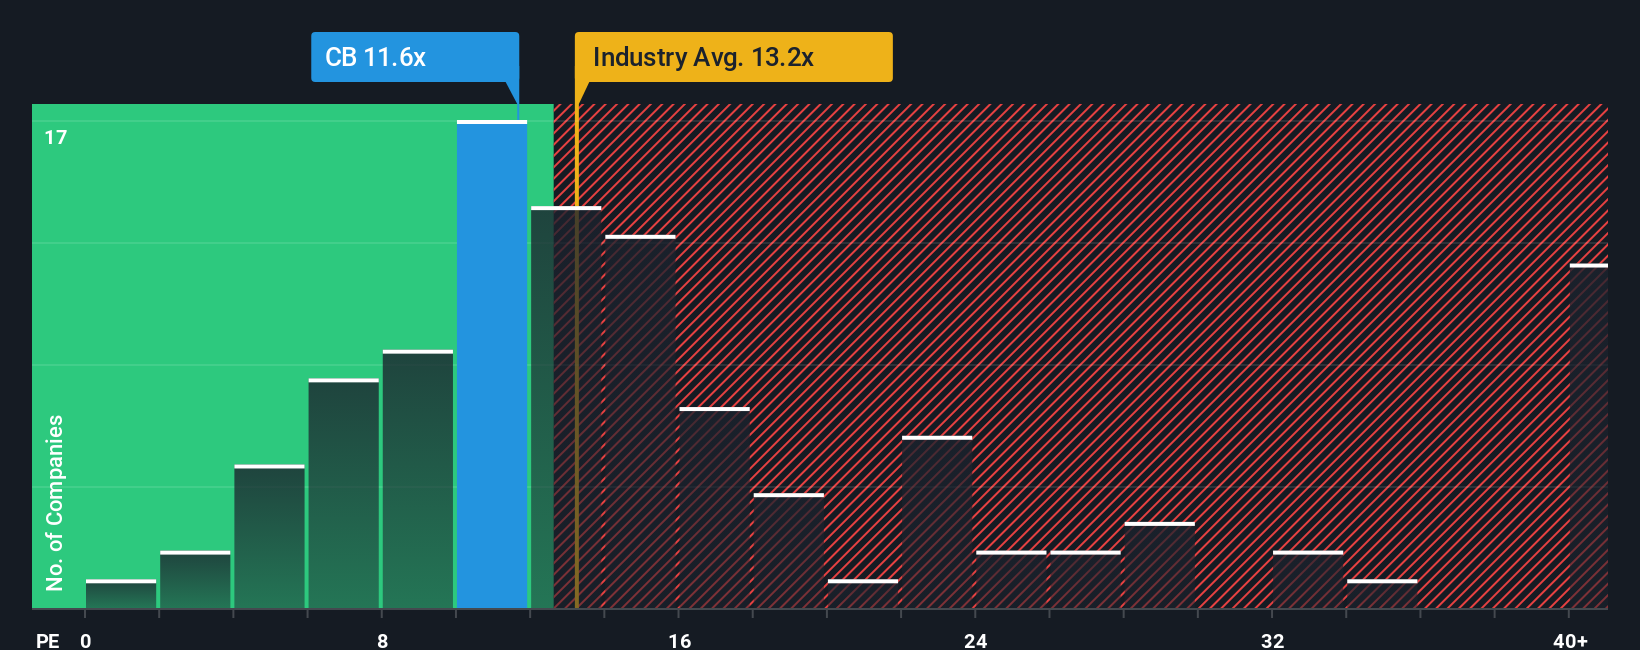
Looking at current figures, Chubb trades at 12.4x earnings. That is slightly above its peer average of 11.8x and below the broader insurance industry average of 14.2x. To get a more tailored sense of value, Simply Wall St’s proprietary Fair Ratio takes into account not just comparisons, but also factors unique to Chubb such as its expected earnings growth, profit margins, risk profile, industry, and overall market cap. This approach considers real business fundamentals rather than relying too much on broad averages.
Chubb’s Fair Ratio is 14.8x. When you weigh that against the current PE ratio of 12.4x, it points to the shares trading below what would be expected given the company’s financial profile and operating context. This supports a view that Chubb stock is undervalued according to the preferred multiple approach.
Result: UNDERVALUED
PE ratios tell one story, but what if the real opportunity lies elsewhere? Discover companies where insiders are betting big on explosive growth.
Upgrade Your Decision Making: Choose your Chubb Narrative
Earlier, we mentioned that there is an even better way to understand valuation, so let us introduce you to Narratives. A Narrative is simply your story about where you see a company like Chubb heading and the assumptions you make about its future, such as revenue, earnings, and margins, behind your own estimated fair value.
Instead of only looking at static analyst numbers, Narratives help you tie Chubb’s real-world story, whether that is expanding into global markets or navigating catastrophe risks, directly to your financial forecast and then to a fair value. This means you can see exactly how your expectations compare to the current share price, giving a clearer signal on when to consider buying or selling.
On Simply Wall St’s platform, you can create and follow Narratives easily via the Community page, where millions of investors share their views. Narratives also update automatically when something significant happens, such as new earnings or big news, so your outlook stays relevant.
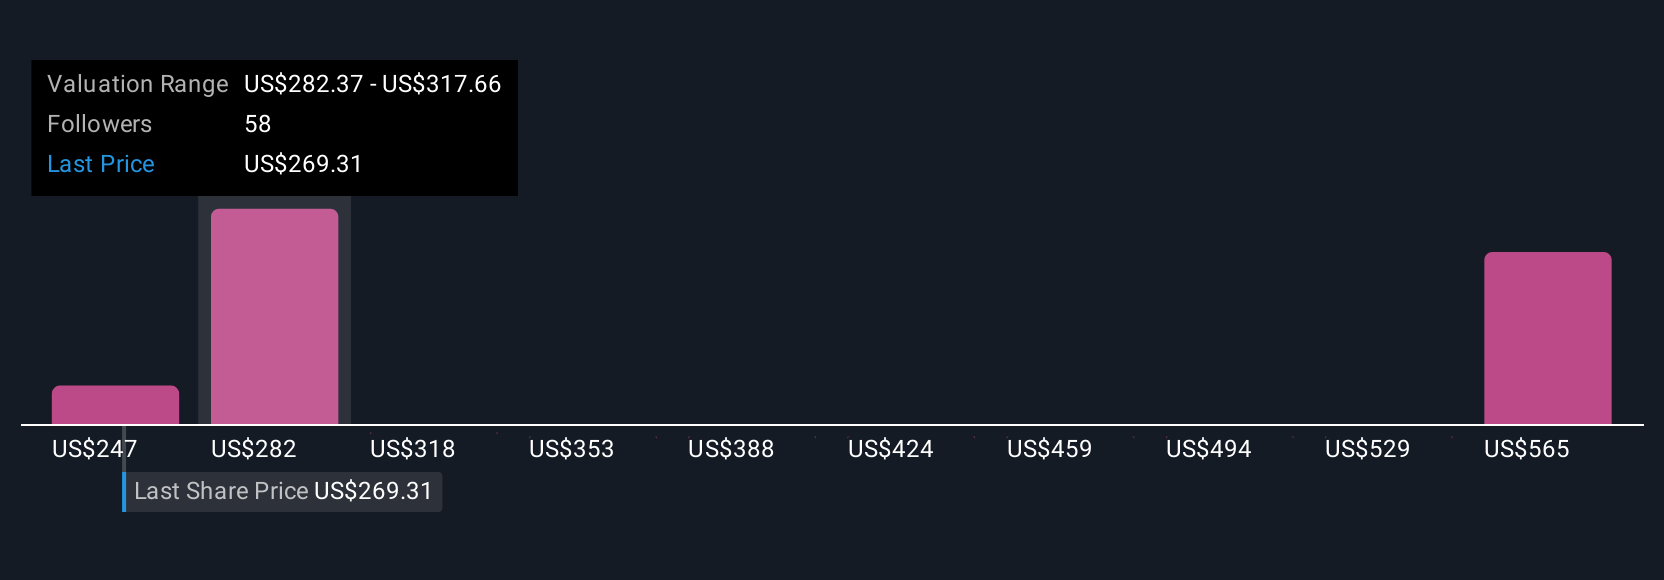
For example, some investors’ Chubb Narratives assume long-term earnings growth and set a fair value as high as $340.0, while others, concerned about declining revenue, estimate fair value at just $267.0. This is a remarkable reminder that every story and valuation is unique, and now you have the tools to build your own smarter Narrative.
For Chubb, however, we'll make it really easy for you with previews of two leading Chubb Narratives:
- 🐂 Chubb Bull Case
Fair Value: $300.90
Undervalued by approximately 4.6%
Revenue growth: -4.8%
- International expansion and digital channels are driving strong, diversified revenue and earnings growth. Disciplined underwriting supports sustained profitability.
- Analysts project earnings to reach $9.8 billion by 2028, with profit margins rising from 16.0% to 19.8%, along with a modest reduction in shares outstanding.
- Key risks include rising competition, catastrophe exposure, volatile emerging markets, and regulatory challenges. The consensus analyst price target of $300.90 suggests the stock is fairly valued near current prices, depending on individual assumptions.
- 🐻 Chubb Bear Case
Fair Value: $247.08
Overvalued by approximately 16.2%
Revenue growth: 2.6%
- Chubb’s diversified insurance model and global reach are acknowledged. However, competition in both traditional and insurtech markets is high, resulting in margin pressure and limited pricing power.
- The insurance industry faces regulatory challenges, technological disruption, and shifting customer expectations. These factors may slow growth and increase risk exposure for Chubb.
- Based on long-term growth assumptions and a 12% discount rate, this narrative sets a lower fair value for Chubb and cautions that the stock is likely overvalued at the current price unless growth accelerates or risk perceptions improve.
Do you think there's more to the story for Chubb? Create your own Narrative to let the Community know!
This article by Simply Wall St is general in nature. We provide commentary based on historical data and analyst forecasts only using an unbiased methodology and our articles are not intended to be financial advice. It does not constitute a recommendation to buy or sell any stock, and does not take account of your objectives, or your financial situation. We aim to bring you long-term focused analysis driven by fundamental data. Note that our analysis may not factor in the latest price-sensitive company announcements or qualitative material. Simply Wall St has no position in any stocks mentioned.
New: AI Stock Screener & Alerts
Our new AI Stock Screener scans the market every day to uncover opportunities.
• Dividend Powerhouses (3%+ Yield)
• Undervalued Small Caps with Insider Buying
• High growth Tech and AI Companies
Or build your own from over 50 metrics.
Have feedback on this article? Concerned about the content? Get in touch with us directly. Alternatively, email editorial-team@simplywallst.com
About NYSE:CB
Good value with adequate balance sheet and pays a dividend.
Similar Companies
Market Insights

Advertisement
Community Narratives
Kodiak AI - a potential 100 bagger opportunity?
Fair Value US$14.00|44.7% undervalued
DA
Community Contributor
A Fair Price for a Great Business Facing Real Threats
Fair Value US$383.06|13.0% undervalued
IM
Community Contributor
AXON And Shopify Integration Will Unlock Global Mobile Advertising
Fair Value US$646.30|0% overvalued
AN
Based on Analyst Price Targets