Advertisement
- United States
- /
- Insurance
- /
- NYSE:BRO
Does Brown & Brown’s Stock Price Reflect Its Real Value After Recent Soft Results in 2025?

Simply Wall St
Reviewed by Bailey Pemberton
Thinking about what to do with Brown & Brown stock? You are not alone. Investors everywhere are eyeing its recent moves, trying to make sense of where it stands after a decade marked by impressive growth. The past year has not exactly been a rollercoaster, but the trends are worth a closer look. Year to date, shares are down by 6.0%, while the one-year return clocks in at -10.3%. That sounds lukewarm, but take a step back and you will see the bigger picture. Over the last three years, Brown & Brown has surged 57.2%, and it has more than doubled over the last five years with a 110.3% return.
Why the recent stalling after such a strong run? Some of it comes down to shifts in market sentiment as investors take stock of the insurance sector, weighing broad market developments and risk appetite. There is also speculation about potential changes in the competitive landscape, which can trigger mixed reactions and leave some folks sideline-sitting for now.
But here is the core question: at $94.48 per share, is Brown & Brown undervalued, fairly valued, or maybe even pricey by different measures? Our current valuation score puts it at 1 out of 6 checks for undervaluation, meaning there may not be a dramatic bargain on the surface. Of course, those scores do not always tell the whole story. Next, let us break down the major valuation methods before digging into what really matters for long-term investors, the deeper context behind the numbers.
Brown & Brown scores just 1/6 on our valuation checks. See what other red flags we found in the full valuation breakdown.
Approach 1: Brown & Brown Excess Returns Analysis
The Excess Returns model is designed to reveal how much value a company creates above its cost of capital. In other words, it measures whether Brown & Brown is earning more from its shareholders' equity than it costs to fund that equity, which is an important gauge of long-term value creation.
Breaking down the numbers: Brown & Brown’s Book Value stands at $35.13 per share, with a stable Earnings Per Share (EPS) estimated at $2.77. These projections draw from weighted future Return on Equity (ROE) estimates by four analysts. The company’s Cost of Equity is $1.33 per share. The resulting Excess Return comes in at $1.44 per share. Over the recent period, Brown & Brown has posted an average ROE of 14.14%. Median Book Value from the past five years gives a stable benchmark of $19.60 per share for ongoing value measurement.
This model’s outcome places Brown & Brown’s intrinsic value well below its current price, estimating the stock is 61.1% overvalued compared to where excess returns suggest it should trade. Despite robust profitability metrics, the present share price looks hard to justify on the basis of excess returns alone.
Result: OVERVALUED
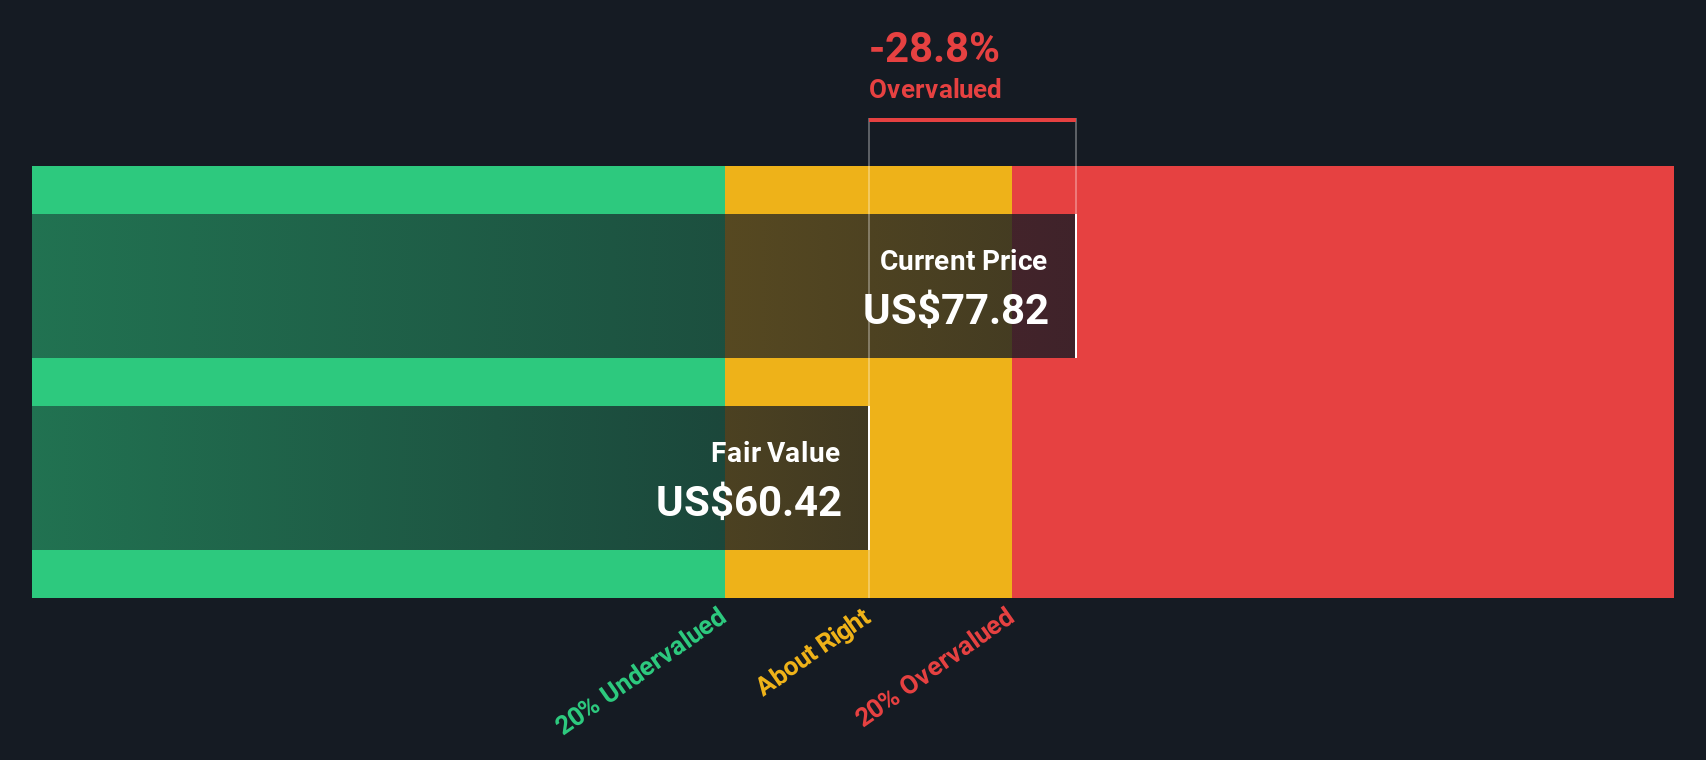
Our Excess Returns analysis suggests Brown & Brown may be overvalued by 61.1%. Find undervalued stocks or create your own screener to find better value opportunities.
Approach 2: Brown & Brown Price vs Earnings
For profitable companies like Brown & Brown, the Price-to-Earnings (PE) ratio is a widely used valuation metric because it directly compares a company’s share price to its per-share earnings. This helps investors gauge how much they are paying for each dollar of profit, which is especially relevant when those profits are steady and predictable.
Growth expectations and a company's risk profile both play a role in shaping what constitutes a “fair” PE ratio. Generally, higher growth prospects or lower perceived risks can justify a higher PE, while slower growth or greater uncertainty should warrant a lower multiple.
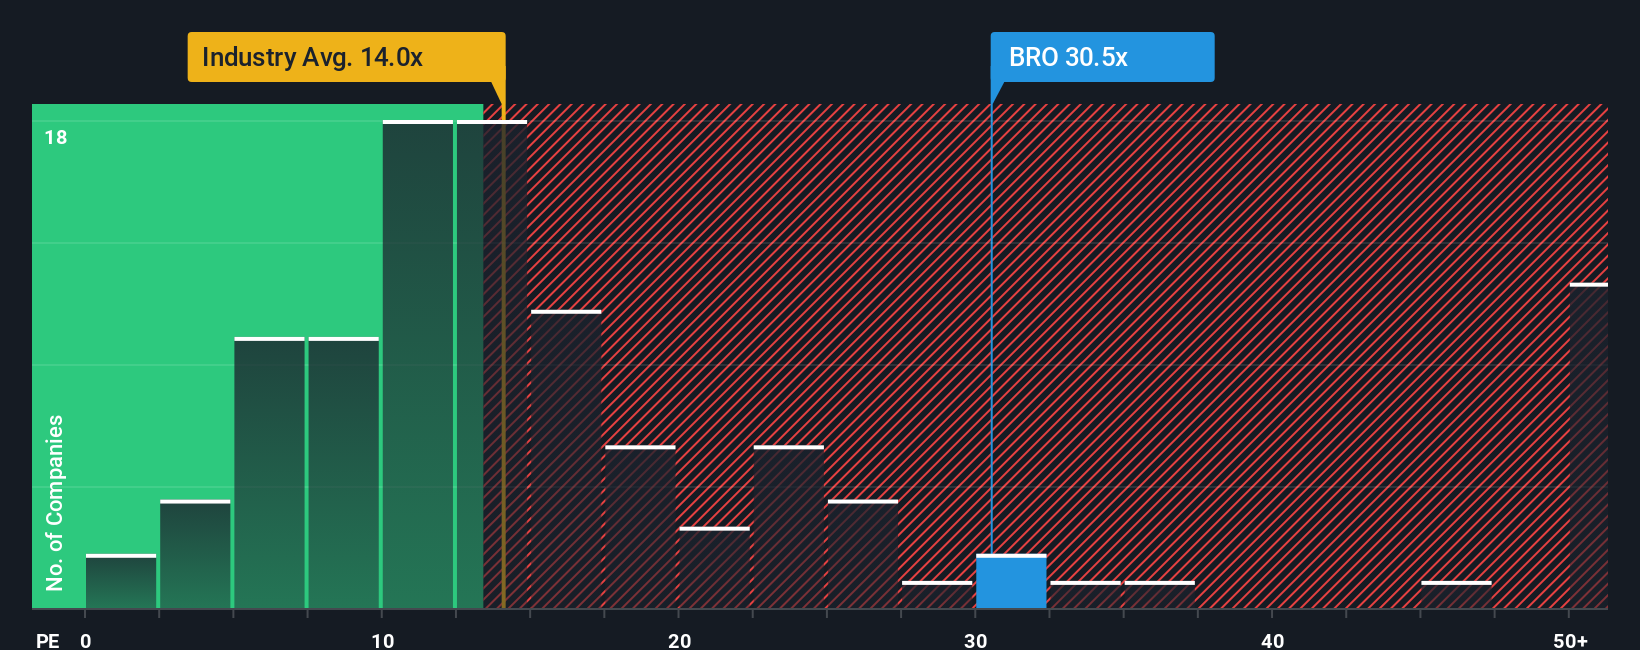
Looking at the numbers, Brown & Brown is currently trading at a PE ratio of 31.35x. This is significantly above the average for the insurance industry, which sits at 13.91x. It is also much higher than the average PE of its peers at 55.21x. This indicates that investors are currently willing to pay a premium for Brown & Brown compared to many insurers.
To add more context, Simply Wall St has developed a proprietary “Fair Ratio” metric that factors in the company’s specific growth forecast, risk levels, profit margin, industry, and market cap. The Fair Ratio is 18.68x for Brown & Brown. This provides a more nuanced benchmark than simply looking at industry or peer averages because it tailors the expected multiple to the company’s unique characteristics.
Comparing the actual PE (31.35x) to the Fair Ratio (18.68x), Brown & Brown appears overvalued on this metric, as investors are paying quite a bit more than what fundamentals alone would suggest is warranted.
Result: OVERVALUED
PE ratios tell one story, but what if the real opportunity lies elsewhere? Discover companies where insiders are betting big on explosive growth.
Upgrade Your Decision Making: Choose your Brown & Brown Narrative
Earlier we mentioned that there is an even better way to understand valuation, so let us introduce you to Narratives. A Narrative is your unique investment story, connecting what you believe about a company to concrete forecasts, such as future revenue, earnings, and margins, and then to a clear estimate of fair value. This approach goes beyond static metrics by helping you link your view of Brown & Brown’s opportunities or challenges directly to financial outcomes and what you think its shares are truly worth.
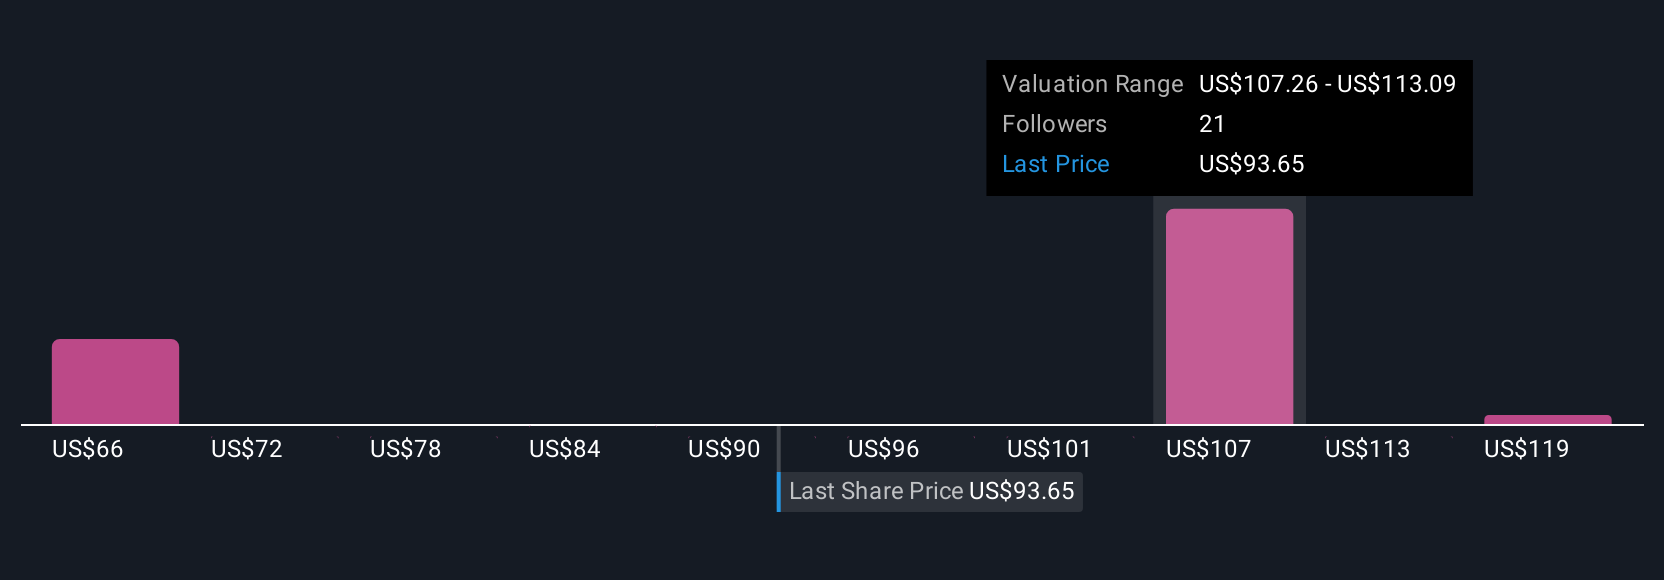
Narratives are accessible, easy-to-use tools available within the Simply Wall St Community page, used by millions of investors to explain the “why” behind the numbers and quickly update their perspectives when new news or results emerge. Comparing your Narrative’s fair value to the current price can make buy or sell decisions simpler and more logical, and root them in what you genuinely believe will shape Brown & Brown’s future performance. For example, one investor’s Narrative might see Brown & Brown’s fair value as $130 per share, thanks to confidence in strong acquisitions and cost control. Another might see just $87, citing margin pressures and industry risks. Narratives let you quickly sense-check your view in light of real-world developments and expert disagreement, all in one place.
Do you think there's more to the story for Brown & Brown? Create your own Narrative to let the Community know!
This article by Simply Wall St is general in nature. We provide commentary based on historical data and analyst forecasts only using an unbiased methodology and our articles are not intended to be financial advice. It does not constitute a recommendation to buy or sell any stock, and does not take account of your objectives, or your financial situation. We aim to bring you long-term focused analysis driven by fundamental data. Note that our analysis may not factor in the latest price-sensitive company announcements or qualitative material. Simply Wall St has no position in any stocks mentioned.
Valuation is complex, but we're here to simplify it.
Discover if Brown & Brown might be undervalued or overvalued with our detailed analysis, featuring fair value estimates, potential risks, dividends, insider trades, and its financial condition.
Access Free AnalysisHave feedback on this article? Concerned about the content? Get in touch with us directly. Alternatively, email editorial-team@simplywallst.com
About NYSE:BRO
Brown & Brown
Brown & Brown, Inc. markets and sells insurance products and services in the United States, Canada, Ireland, the United Kingdom, and internationally.
Adequate balance sheet with moderate growth potential.
Similar Companies
Market Insights

Advertisement
Community Narratives
A formidable player in AI and enterprise computing.
Fair Value US$210.00|3.1% overvalued
CO
Community Contributor
IREN's Bold Moves in Sustainable Bitcoin Mining & AI Data Centers
Fair Value US$72.52|11.6% undervalued
BL
Community Contributor
Cooling the Champions: The Aussie Tech Behind F1's Victories
Fair Value AU$12.40|39.4% undervalued
TR
Community Contributor