- United States
- /
- Insurance
- /
- NasdaqCM:RELI
It's Down 43% But Reliance Global Group, Inc. (NASDAQ:RELI) Could Be Riskier Than It Looks


To the annoyance of some shareholders, Reliance Global Group, Inc. (NASDAQ:RELI) shares are down a considerable 43% in the last month, which continues a horrid run for the company. The recent drop completes a disastrous twelve months for shareholders, who are sitting on a 94% loss during that time.
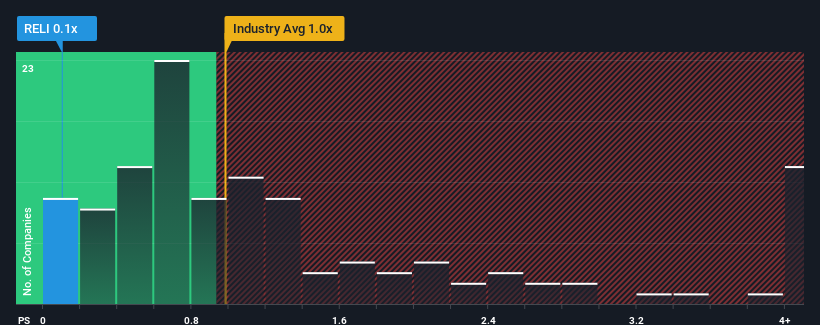
After such a large drop in price, considering around half the companies operating in the United States' Insurance industry have price-to-sales ratios (or "P/S") above 1x, you may consider Reliance Global Group as an solid investment opportunity with its 0.1x P/S ratio. However, the P/S might be low for a reason and it requires further investigation to determine if it's justified.
See our latest analysis for Reliance Global Group
How Has Reliance Global Group Performed Recently?
With revenue growth that's exceedingly strong of late, Reliance Global Group has been doing very well. It might be that many expect the strong revenue performance to degrade substantially, which has repressed the P/S ratio. Those who are bullish on Reliance Global Group will be hoping that this isn't the case, so that they can pick up the stock at a lower valuation.
Want the full picture on earnings, revenue and cash flow for the company? Then our free report on Reliance Global Group will help you shine a light on its historical performance.What Are Revenue Growth Metrics Telling Us About The Low P/S?
Reliance Global Group's P/S ratio would be typical for a company that's only expected to deliver limited growth, and importantly, perform worse than the industry.
Taking a look back first, we see that the company grew revenue by an impressive 63% last year. The strong recent performance means it was also able to grow revenue by 161% in total over the last three years. Accordingly, shareholders would have definitely welcomed those medium-term rates of revenue growth.
Comparing that to the industry, which is only predicted to deliver 6.4% growth in the next 12 months, the company's momentum is stronger based on recent medium-term annualised revenue results.
With this information, we find it odd that Reliance Global Group is trading at a P/S lower than the industry. It looks like most investors are not convinced the company can maintain its recent growth rates.
The Final Word
The southerly movements of Reliance Global Group's shares means its P/S is now sitting at a pretty low level. Using the price-to-sales ratio alone to determine if you should sell your stock isn't sensible, however it can be a practical guide to the company's future prospects.
Our examination of Reliance Global Group revealed its three-year revenue trends aren't boosting its P/S anywhere near as much as we would have predicted, given they look better than current industry expectations. When we see strong revenue with faster-than-industry growth, we assume there are some significant underlying risks to the company's ability to make money which is applying downwards pressure on the P/S ratio. While recent revenue trends over the past medium-term suggest that the risk of a price decline is low, investors appear to perceive a likelihood of revenue fluctuations in the future.
And what about other risks? Every company has them, and we've spotted 4 warning signs for Reliance Global Group you should know about.
If strong companies turning a profit tickle your fancy, then you'll want to check out this free list of interesting companies that trade on a low P/E (but have proven they can grow earnings).
New: AI Stock Screener & Alerts
Our new AI Stock Screener scans the market every day to uncover opportunities.
• Dividend Powerhouses (3%+ Yield)
• Undervalued Small Caps with Insider Buying
• High growth Tech and AI Companies
Or build your own from over 50 metrics.
Have feedback on this article? Concerned about the content? Get in touch with us directly. Alternatively, email editorial-team (at) simplywallst.com.
This article by Simply Wall St is general in nature. We provide commentary based on historical data and analyst forecasts only using an unbiased methodology and our articles are not intended to be financial advice. It does not constitute a recommendation to buy or sell any stock, and does not take account of your objectives, or your financial situation. We aim to bring you long-term focused analysis driven by fundamental data. Note that our analysis may not factor in the latest price-sensitive company announcements or qualitative material. Simply Wall St has no position in any stocks mentioned.
About NasdaqCM:RELI
Reliance Global Group
Focuses in the acquisition and management of wholesale and retail insurance agencies in the United States.
Moderate and slightly overvalued.
Market Insights

Community Narratives
