Stock Analysis
- United States
- /
- Insurance
- /
- NasdaqGS:PFG
Principal Financial Group (NASDAQ:PFG) shareholders have earned a 11% CAGR over the last five years


When you buy and hold a stock for the long term, you definitely want it to provide a positive return. Furthermore, you'd generally like to see the share price rise faster than the market. But Principal Financial Group, Inc. (NASDAQ:PFG) has fallen short of that second goal, with a share price rise of 36% over five years, which is below the market return. Looking at the last year alone, the stock is up 9.5%.
Now it's worth having a look at the company's fundamentals too, because that will help us determine if the long term shareholder return has matched the performance of the underlying business.
See our latest analysis for Principal Financial Group
To quote Buffett, 'Ships will sail around the world but the Flat Earth Society will flourish. There will continue to be wide discrepancies between price and value in the marketplace...' One way to examine how market sentiment has changed over time is to look at the interaction between a company's share price and its earnings per share (EPS).
Principal Financial Group's earnings per share are down 0.2% per year, despite strong share price performance over five years.
So it's hard to argue that the earnings per share are the best metric to judge the company, as it may not be optimized for profits at this point. Since the change in EPS doesn't seem to correlate with the change in share price, it's worth taking a look at other metrics.
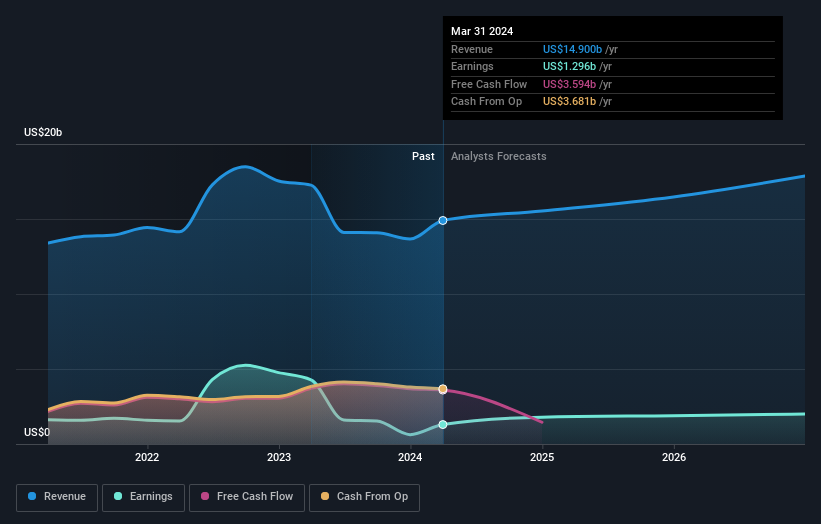
It is not great to see that revenue has dropped by 0.7% per year over five years. So it seems one might have to take closer look at earnings and revenue trends to see how they might influence the share price.
The image below shows how earnings and revenue have tracked over time (if you click on the image you can see greater detail).
Principal Financial Group is a well known stock, with plenty of analyst coverage, suggesting some visibility into future growth. You can see what analysts are predicting for Principal Financial Group in this interactive graph of future profit estimates.
What About Dividends?
When looking at investment returns, it is important to consider the difference between total shareholder return (TSR) and share price return. The TSR incorporates the value of any spin-offs or discounted capital raisings, along with any dividends, based on the assumption that the dividends are reinvested. Arguably, the TSR gives a more comprehensive picture of the return generated by a stock. As it happens, Principal Financial Group's TSR for the last 5 years was 66%, which exceeds the share price return mentioned earlier. The dividends paid by the company have thusly boosted the total shareholder return.
A Different Perspective
Principal Financial Group shareholders gained a total return of 13% during the year. But that was short of the market average. The silver lining is that the gain was actually better than the average annual return of 11% per year over five year. This suggests the company might be improving over time. It's always interesting to track share price performance over the longer term. But to understand Principal Financial Group better, we need to consider many other factors. Even so, be aware that Principal Financial Group is showing 1 warning sign in our investment analysis , you should know about...
We will like Principal Financial Group better if we see some big insider buys. While we wait, check out this free list of undervalued stocks (mostly small caps) with considerable, recent, insider buying.
Please note, the market returns quoted in this article reflect the market weighted average returns of stocks that currently trade on American exchanges.
Valuation is complex, but we're helping make it simple.
Find out whether Principal Financial Group is potentially over or undervalued by checking out our comprehensive analysis, which includes fair value estimates, risks and warnings, dividends, insider transactions and financial health.
View the Free AnalysisHave feedback on this article? Concerned about the content? Get in touch with us directly. Alternatively, email editorial-team (at) simplywallst.com.
This article by Simply Wall St is general in nature. We provide commentary based on historical data and analyst forecasts only using an unbiased methodology and our articles are not intended to be financial advice. It does not constitute a recommendation to buy or sell any stock, and does not take account of your objectives, or your financial situation. We aim to bring you long-term focused analysis driven by fundamental data. Note that our analysis may not factor in the latest price-sensitive company announcements or qualitative material. Simply Wall St has no position in any stocks mentioned.
Valuation is complex, but we're helping make it simple.
Find out whether Principal Financial Group is potentially over or undervalued by checking out our comprehensive analysis, which includes fair value estimates, risks and warnings, dividends, insider transactions and financial health.
View the Free AnalysisHave feedback on this article? Concerned about the content? Get in touch with us directly. Alternatively, email editorial-team@simplywallst.com
About NasdaqGS:PFG
Principal Financial Group
Provides retirement, asset management, and insurance products and services to businesses, individuals, and institutional clients worldwide.
Established dividend payer and fair value.
