
Advertisement
- United States
- /
- Insurance
- /
- NasdaqGM:AAME
What Is Atlantic American's (NASDAQ:AAME) P/E Ratio After Its Share Price Tanked?

To the annoyance of some shareholders, Atlantic American (NASDAQ:AAME) shares are down a considerable 31% in the last month. That drop has capped off a tough year for shareholders, with the share price down 45% in that time.
Assuming nothing else has changed, a lower share price makes a stock more attractive to potential buyers. In the long term, share prices tend to follow earnings per share, but in the short term prices bounce around in response to short term factors (which are not always obvious). So, on certain occasions, long term focussed investors try to take advantage of pessimistic expectations to buy shares at a better price. One way to gauge market expectations of a stock is to look at its Price to Earnings Ratio (PE Ratio). A high P/E implies that investors have high expectations of what a company can achieve compared to a company with a low P/E ratio.
View our latest analysis for Atlantic American
How Does Atlantic American's P/E Ratio Compare To Its Peers?
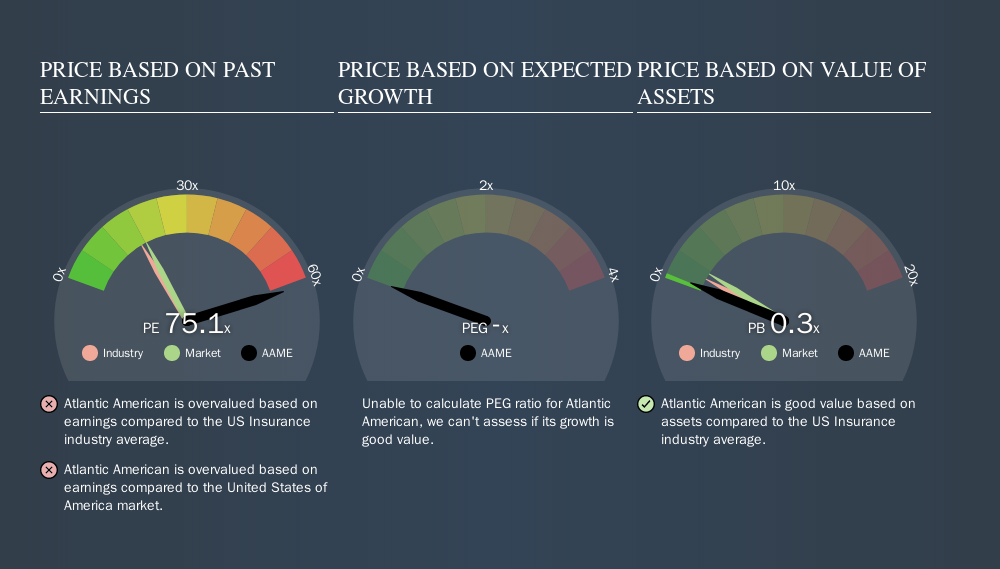
Atlantic American's P/E of 75.11 indicates some degree of optimism towards the stock. As you can see below, Atlantic American has a much higher P/E than the average company (16.8) in the insurance industry.
Its relatively high P/E ratio indicates that Atlantic American shareholders think it will perform better than other companies in its industry classification. Shareholders are clearly optimistic, but the future is always uncertain. So investors should delve deeper. I like to check if company insiders have been buying or selling.
How Growth Rates Impact P/E Ratios
Companies that shrink earnings per share quickly will rapidly decrease the 'E' in the equation. Therefore, even if you pay a low multiple of earnings now, that multiple will become higher in the future. A higher P/E should indicate the stock is expensive relative to others -- and that may encourage shareholders to sell.
Atlantic American's earnings per share fell by 55% in the last twelve months. And it has shrunk its earnings per share by 38% per year over the last five years. This could justify a pessimistic P/E.
Don't Forget: The P/E Does Not Account For Debt or Bank Deposits
The 'Price' in P/E reflects the market capitalization of the company. So it won't reflect the advantage of cash, or disadvantage of debt. In theory, a company can lower its future P/E ratio by using cash or debt to invest in growth.
Such spending might be good or bad, overall, but the key point here is that you need to look at debt to understand the P/E ratio in context.
Atlantic American's Balance Sheet
Atlantic American has net debt worth 63% of its market capitalization. This is enough debt that you'd have to make some adjustments before using the P/E ratio to compare it to a company with net cash.
The Bottom Line On Atlantic American's P/E Ratio
Atlantic American's P/E is 75.1 which suggests the market is more focussed on the future opportunity rather than the current level of earnings. With significant debt and no EPS growth last year, shareholders are betting on an improvement in earnings from the company. What can be absolutely certain is that the market has become significantly less optimistic about Atlantic American over the last month, with the P/E ratio falling from 109.0 back then to 75.1 today. For those who don't like to trade against momentum, that could be a warning sign, but a contrarian investor might want to take a closer look.
When the market is wrong about a stock, it gives savvy investors an opportunity. As value investor Benjamin Graham famously said, 'In the short run, the market is a voting machine but in the long run, it is a weighing machine. We don't have analyst forecasts, but shareholders might want to examine this detailed historical graph of earnings, revenue and cash flow.
Of course, you might find a fantastic investment by looking at a few good candidates. So take a peek at this free list of companies with modest (or no) debt, trading on a P/E below 20.
We aim to bring you long-term focused research analysis driven by fundamental data. Note that our analysis may not factor in the latest price-sensitive company announcements or qualitative material.
If you spot an error that warrants correction, please contact the editor at editorial-team@simplywallst.com. This article by Simply Wall St is general in nature. It does not constitute a recommendation to buy or sell any stock, and does not take account of your objectives, or your financial situation. Simply Wall St has no position in the stocks mentioned. Thank you for reading.
About NasdaqGM:AAME
Atlantic American
Through its subsidiaries, provides life and health, and property and casualty insurance products in the United States.
Mediocre balance sheet and slightly overvalued.
Similar Companies
Market Insights


Advertisement
Community Narratives
For the Emperor: Why Games Workshop Could Be a Star Investment
Fair Value UK£160.00|0.4% overvalued
RO
Community Contributor
Securitas will boost margins with AI and tech-driven services
Fair Value SEK 260.91|44.5% undervalued
UN
Community Contributor
A Leader in EV Charging with Growth Potential
Fair Value €27.00|17.8% undervalued
TI
Community Contributor