- United States
- /
- Household Products
- /
- NYSE:PG
Is There An Opportunity With The Procter & Gamble Company's (NYSE:PG) 23% Undervaluation?

Key Insights
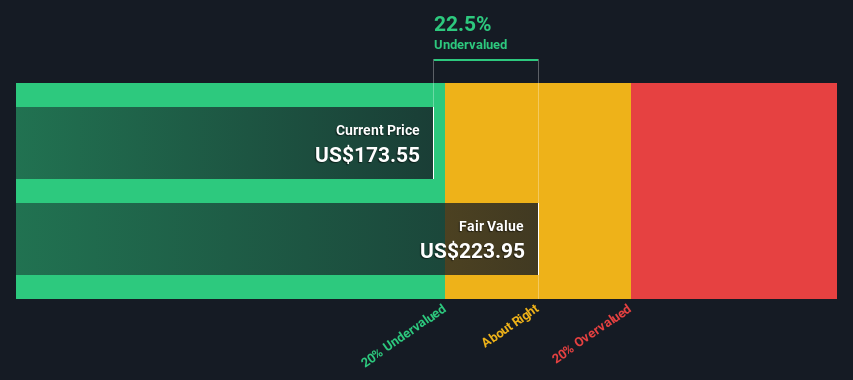
- The projected fair value for Procter & Gamble is US$224 based on 2 Stage Free Cash Flow to Equity
- Current share price of US$174 suggests Procter & Gamble is potentially 23% undervalued
- Analyst price target for PG is US$177 which is 21% below our fair value estimate
In this article we are going to estimate the intrinsic value of The Procter & Gamble Company (NYSE:PG) by estimating the company's future cash flows and discounting them to their present value. We will take advantage of the Discounted Cash Flow (DCF) model for this purpose. Don't get put off by the jargon, the math behind it is actually quite straightforward.
We would caution that there are many ways of valuing a company and, like the DCF, each technique has advantages and disadvantages in certain scenarios. Anyone interested in learning a bit more about intrinsic value should have a read of the Simply Wall St analysis model.
View our latest analysis for Procter & Gamble
The Model
We use what is known as a 2-stage model, which simply means we have two different periods of growth rates for the company's cash flows. Generally the first stage is higher growth, and the second stage is a lower growth phase. To begin with, we have to get estimates of the next ten years of cash flows. Where possible we use analyst estimates, but when these aren't available we extrapolate the previous free cash flow (FCF) from the last estimate or reported value. We assume companies with shrinking free cash flow will slow their rate of shrinkage, and that companies with growing free cash flow will see their growth rate slow, over this period. We do this to reflect that growth tends to slow more in the early years than it does in later years.
A DCF is all about the idea that a dollar in the future is less valuable than a dollar today, and so the sum of these future cash flows is then discounted to today's value:
10-year free cash flow (FCF) estimate
| 2025 | 2026 | 2027 | 2028 | 2029 | 2030 | 2031 | 2032 | 2033 | 2034 | |
| Levered FCF ($, Millions) | US$16.7b | US$17.7b | US$18.5b | US$18.4b | US$19.2b | US$19.7b | US$20.2b | US$20.7b | US$21.2b | US$21.7b |
| Growth Rate Estimate Source | Analyst x7 | Analyst x7 | Analyst x2 | Analyst x1 | Analyst x1 | Est @ 2.42% | Est @ 2.45% | Est @ 2.46% | Est @ 2.47% | Est @ 2.48% |
| Present Value ($, Millions) Discounted @ 5.8% | US$15.7k | US$15.8k | US$15.6k | US$14.7k | US$14.5k | US$14.0k | US$13.6k | US$13.2k | US$12.7k | US$12.3k |
("Est" = FCF growth rate estimated by Simply Wall St)
Present Value of 10-year Cash Flow (PVCF) = US$142b
The second stage is also known as Terminal Value, this is the business's cash flow after the first stage. The Gordon Growth formula is used to calculate Terminal Value at a future annual growth rate equal to the 5-year average of the 10-year government bond yield of 2.5%. We discount the terminal cash flows to today's value at a cost of equity of 5.8%.
Terminal Value (TV)= FCF2034 × (1 + g) ÷ (r – g) = US$22b× (1 + 2.5%) ÷ (5.8%– 2.5%) = US$675b
Present Value of Terminal Value (PVTV)= TV / (1 + r)10= US$675b÷ ( 1 + 5.8%)10= US$384b
The total value, or equity value, is then the sum of the present value of the future cash flows, which in this case is US$526b. The last step is to then divide the equity value by the number of shares outstanding. Compared to the current share price of US$174, the company appears a touch undervalued at a 23% discount to where the stock price trades currently. Remember though, that this is just an approximate valuation, and like any complex formula - garbage in, garbage out.
The Assumptions
The calculation above is very dependent on two assumptions. The first is the discount rate and the other is the cash flows. If you don't agree with these result, have a go at the calculation yourself and play with the assumptions. The DCF also does not consider the possible cyclicality of an industry, or a company's future capital requirements, so it does not give a full picture of a company's potential performance. Given that we are looking at Procter & Gamble as potential shareholders, the cost of equity is used as the discount rate, rather than the cost of capital (or weighted average cost of capital, WACC) which accounts for debt. In this calculation we've used 5.8%, which is based on a levered beta of 0.800. Beta is a measure of a stock's volatility, compared to the market as a whole. We get our beta from the industry average beta of globally comparable companies, with an imposed limit between 0.8 and 2.0, which is a reasonable range for a stable business.
SWOT Analysis for Procter & Gamble
- Debt is well covered by earnings and cashflows.
- Dividends are covered by earnings and cash flows.
- Earnings growth over the past year underperformed the Household Products industry.
- Dividend is low compared to the top 25% of dividend payers in the Household Products market.
- Annual earnings are forecast to grow for the next 3 years.
- Good value based on P/E ratio and estimated fair value.
- Annual earnings are forecast to grow slower than the American market.
Next Steps:
Valuation is only one side of the coin in terms of building your investment thesis, and it is only one of many factors that you need to assess for a company. The DCF model is not a perfect stock valuation tool. Instead the best use for a DCF model is to test certain assumptions and theories to see if they would lead to the company being undervalued or overvalued. If a company grows at a different rate, or if its cost of equity or risk free rate changes sharply, the output can look very different. Can we work out why the company is trading at a discount to intrinsic value? For Procter & Gamble, we've put together three relevant aspects you should further research:
- Risks: Consider for instance, the ever-present spectre of investment risk. We've identified 2 warning signs with Procter & Gamble , and understanding them should be part of your investment process.
- Management:Have insiders been ramping up their shares to take advantage of the market's sentiment for PG's future outlook? Check out our management and board analysis with insights on CEO compensation and governance factors.
- Other Solid Businesses: Low debt, high returns on equity and good past performance are fundamental to a strong business. Why not explore our interactive list of stocks with solid business fundamentals to see if there are other companies you may not have considered!
PS. The Simply Wall St app conducts a discounted cash flow valuation for every stock on the NYSE every day. If you want to find the calculation for other stocks just search here.
If you're looking to trade Procter & Gamble, open an account with the lowest-cost platform trusted by professionals, Interactive Brokers.
With clients in over 200 countries and territories, and access to 160 markets, IBKR lets you trade stocks, options, futures, forex, bonds and funds from a single integrated account.
Enjoy no hidden fees, no account minimums, and FX conversion rates as low as 0.03%, far better than what most brokers offer.
Sponsored ContentNew: Manage All Your Stock Portfolios in One Place
We've created the ultimate portfolio companion for stock investors, and it's free.
• Connect an unlimited number of Portfolios and see your total in one currency
• Be alerted to new Warning Signs or Risks via email or mobile
• Track the Fair Value of your stocks
Have feedback on this article? Concerned about the content? Get in touch with us directly. Alternatively, email editorial-team (at) simplywallst.com.
This article by Simply Wall St is general in nature. We provide commentary based on historical data and analyst forecasts only using an unbiased methodology and our articles are not intended to be financial advice. It does not constitute a recommendation to buy or sell any stock, and does not take account of your objectives, or your financial situation. We aim to bring you long-term focused analysis driven by fundamental data. Note that our analysis may not factor in the latest price-sensitive company announcements or qualitative material. Simply Wall St has no position in any stocks mentioned.
About NYSE:PG
Procter & Gamble
Engages in the provision of branded consumer packaged goods worldwide.
Solid track record established dividend payer.
Similar Companies
Market Insights


Community Narratives


