- United States
- /
- Personal Products
- /
- NYSE:NUS
Is Nu Skin Enterprises, Inc. (NYSE:NUS) Expensive For A Reason? A Look At Its Intrinsic Value


Key Insights
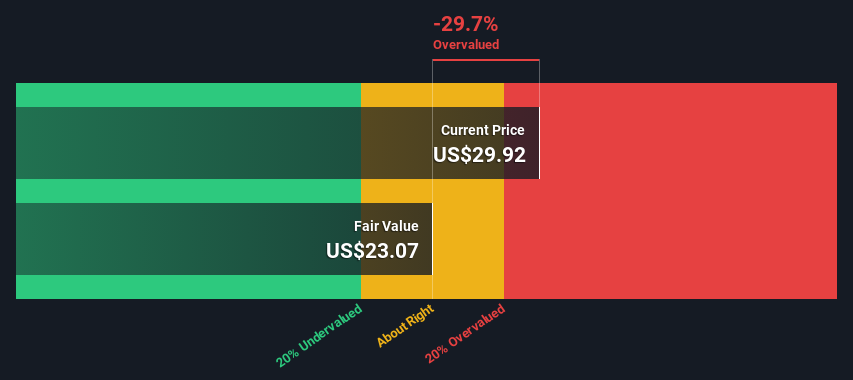
- Using the Dividend Discount Model, Nu Skin Enterprises fair value estimate is US$23.07
- Current share price of US$29.92 suggests Nu Skin Enterprises is potentially 30% overvalued
- The US$40.25 analyst price target for NUS is 74% more than our estimate of fair value
Today we will run through one way of estimating the intrinsic value of Nu Skin Enterprises, Inc. (NYSE:NUS) by estimating the company's future cash flows and discounting them to their present value. Our analysis will employ the Discounted Cash Flow (DCF) model. Models like these may appear beyond the comprehension of a lay person, but they're fairly easy to follow.
Remember though, that there are many ways to estimate a company's value, and a DCF is just one method. Anyone interested in learning a bit more about intrinsic value should have a read of the Simply Wall St analysis model.
See our latest analysis for Nu Skin Enterprises
Crunching The Numbers
We have to calculate the value of Nu Skin Enterprises slightly differently to other stocks because it is a personal products company. In this approach dividends per share (DPS) are used, as free cash flow is difficult to estimate and often not reported by analysts. Unless a company pays out the majority of its FCF as a dividend, this method will typically underestimate the value of the stock. The 'Gordon Growth Model' is used, which simply assumes that dividend payments will continue to increase at a sustainable growth rate forever. The dividend is expected to grow at an annual growth rate equal to the 5-year average of the 10-year government bond yield of 2.1%. We then discount this figure to today's value at a cost of equity of 9.0%. Compared to the current share price of US$29.9, the company appears slightly overvalued at the time of writing. Valuations are imprecise instruments though, rather like a telescope - move a few degrees and end up in a different galaxy. Do keep this in mind.
Value Per Share = Expected Dividend Per Share / (Discount Rate - Perpetual Growth Rate)
= US$1.6 / (9.0% – 2.1%)
= US$23.1
The Assumptions
The calculation above is very dependent on two assumptions. The first is the discount rate and the other is the cash flows. If you don't agree with these result, have a go at the calculation yourself and play with the assumptions. The DCF also does not consider the possible cyclicality of an industry, or a company's future capital requirements, so it does not give a full picture of a company's potential performance. Given that we are looking at Nu Skin Enterprises as potential shareholders, the cost of equity is used as the discount rate, rather than the cost of capital (or weighted average cost of capital, WACC) which accounts for debt. In this calculation we've used 9.0%, which is based on a levered beta of 1.156. Beta is a measure of a stock's volatility, compared to the market as a whole. We get our beta from the industry average beta of globally comparable companies, with an imposed limit between 0.8 and 2.0, which is a reasonable range for a stable business.
SWOT Analysis for Nu Skin Enterprises
- Debt is well covered by earnings.
- Dividend is in the top 25% of dividend payers in the market.
- Earnings declined over the past year.
- Annual earnings are forecast to grow faster than the American market.
- Good value based on P/E ratio compared to estimated Fair P/E ratio.
- Debt is not well covered by operating cash flow.
- Dividends are not covered by earnings and cashflows.
- Annual revenue is forecast to grow slower than the American market.
Looking Ahead:
Valuation is only one side of the coin in terms of building your investment thesis, and it shouldn't be the only metric you look at when researching a company. DCF models are not the be-all and end-all of investment valuation. Instead the best use for a DCF model is to test certain assumptions and theories to see if they would lead to the company being undervalued or overvalued. For instance, if the terminal value growth rate is adjusted slightly, it can dramatically alter the overall result. What is the reason for the share price exceeding the intrinsic value? For Nu Skin Enterprises, we've put together three relevant aspects you should assess:
- Risks: We feel that you should assess the 3 warning signs for Nu Skin Enterprises (1 doesn't sit too well with us!) we've flagged before making an investment in the company.
- Future Earnings: How does NUS's growth rate compare to its peers and the wider market? Dig deeper into the analyst consensus number for the upcoming years by interacting with our free analyst growth expectation chart.
- Other Solid Businesses: Low debt, high returns on equity and good past performance are fundamental to a strong business. Why not explore our interactive list of stocks with solid business fundamentals to see if there are other companies you may not have considered!
PS. The Simply Wall St app conducts a discounted cash flow valuation for every stock on the NYSE every day. If you want to find the calculation for other stocks just search here.
Valuation is complex, but we're here to simplify it.
Discover if Nu Skin Enterprises might be undervalued or overvalued with our detailed analysis, featuring fair value estimates, potential risks, dividends, insider trades, and its financial condition.
Access Free AnalysisHave feedback on this article? Concerned about the content? Get in touch with us directly. Alternatively, email editorial-team (at) simplywallst.com.
This article by Simply Wall St is general in nature. We provide commentary based on historical data and analyst forecasts only using an unbiased methodology and our articles are not intended to be financial advice. It does not constitute a recommendation to buy or sell any stock, and does not take account of your objectives, or your financial situation. We aim to bring you long-term focused analysis driven by fundamental data. Note that our analysis may not factor in the latest price-sensitive company announcements or qualitative material. Simply Wall St has no position in any stocks mentioned.
About NYSE:NUS
Nu Skin Enterprises
Engages in the development and distribution of various beauty and wellness products worldwide.
Excellent balance sheet and good value.
Similar Companies
Market Insights

Community Narratives

