Advertisement
- United States
- /
- Household Products
- /
- NasdaqGS:REYN
Does Reynolds Consumer Products’ Recent Share Rally Signal Opportunity in 2025?

Simply Wall St
Reviewed by Bailey Pemberton
If you have been watching Reynolds Consumer Products lately, you are definitely not alone. Plenty of investors are asking themselves whether now is the right time to buy, sell, or simply hold tight. The stock has been doing some interesting things in recent weeks, with shares edging up 5.8% in the last week and 5.1% over the past month. That kind of short-term momentum hints at renewed optimism from the market. However, the longer-term picture remains more muted, with the stock down 8.0% year-to-date and 13.3% over the past twelve months.
So, why the sudden rally after months of sluggish returns? One reason is that shifts in broader consumer trends and subtle sector rotation have been influencing investor sentiment in companies like Reynolds Consumer Products. The stability of household staples seems to have caught the attention of those seeking some steadiness in the current market environment. Even with those ups and downs, the company now sits at an interesting crossroads. Its value score is a strong 5 out of 6, reflecting that it is undervalued according to almost every major valuation metric analysts use.
If you are keen to see whether this run has staying power or if the market is missing something, let’s break down Reynolds’ valuation from every angle. We will walk through the standard checks, and at the end of this article I will show you an even better way to size up the company’s true worth.
Why Reynolds Consumer Products is lagging behind its peers
Approach 1: Reynolds Consumer Products Discounted Cash Flow (DCF) Analysis
A Discounted Cash Flow (DCF) model estimates a company's intrinsic value by forecasting its future cash flows and then discounting them back to the present using an appropriate rate. This approach aims to determine what the company is truly worth today based on all the cash it is expected to generate in the future.
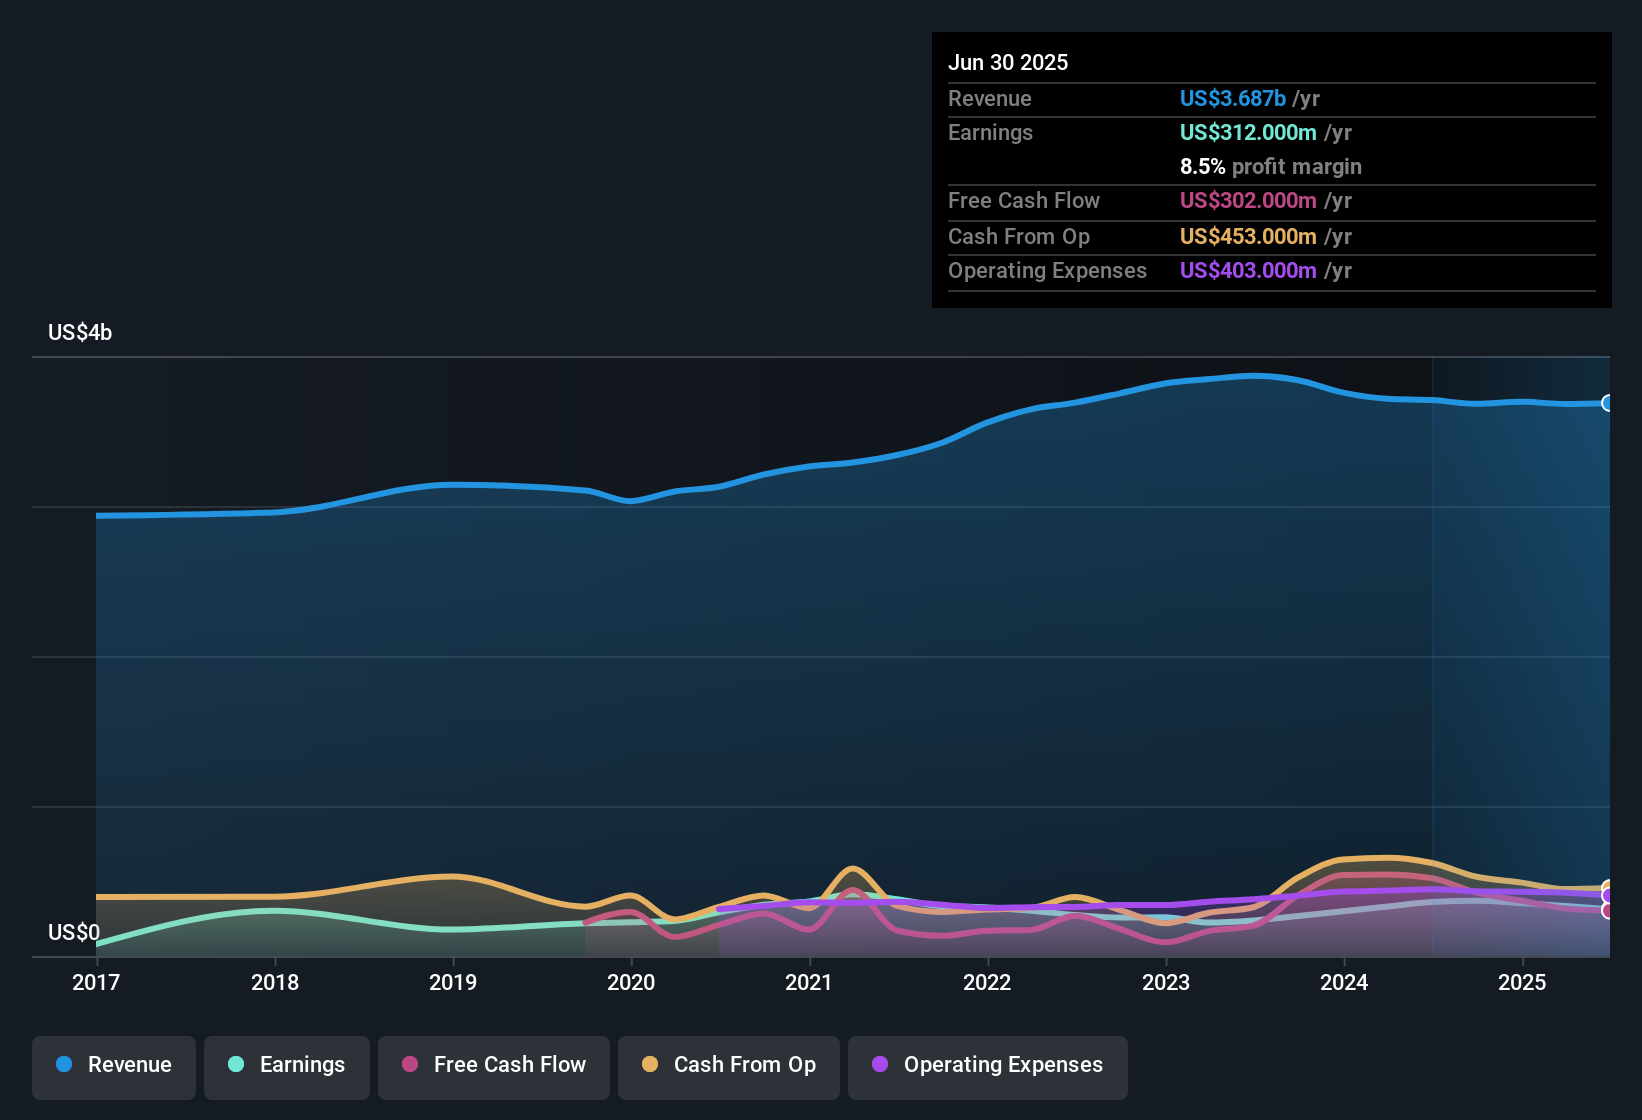
For Reynolds Consumer Products, analysts estimate current Free Cash Flow at $330.2 million, with projections rising gradually over the next decade. Analyst forecasts go out five years, showing 2029 Free Cash Flow reaching around $418.5 million. Beyond this, Simply Wall St extrapolates cash flows out to 2035, with an estimated figure of $515.3 million by that year.
Using the two-stage Free Cash Flow to Equity approach, the model places the intrinsic fair value of Reynolds shares at $49.74. The current analysis implies the stock is trading at a 50.4 percent discount to this value, indicating that, under current assumptions, the shares are significantly undervalued compared to what the company's future earnings could justify.
Result: UNDERVALUED
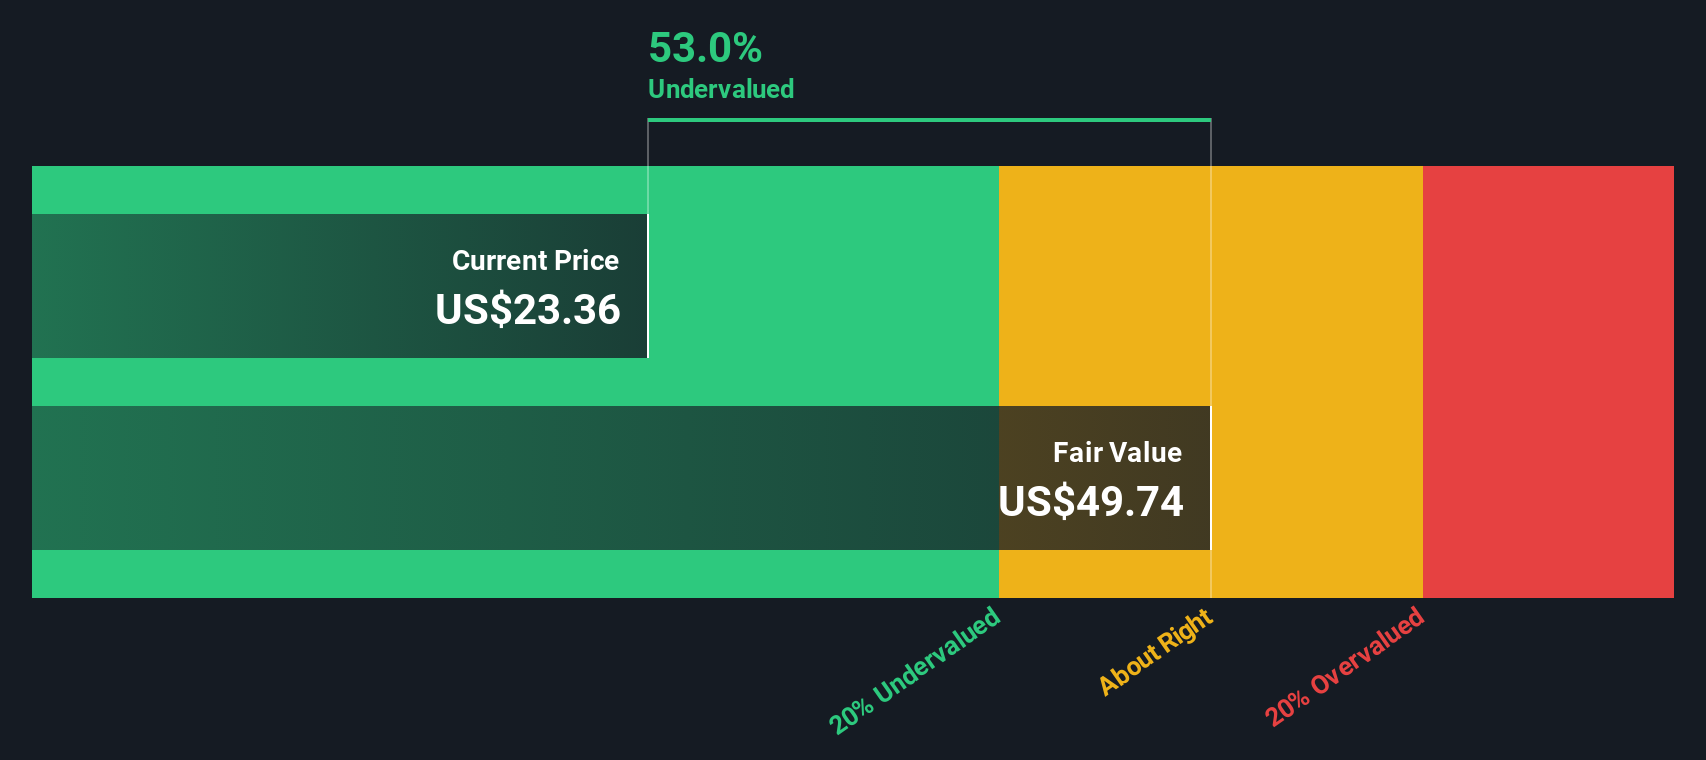
Our Discounted Cash Flow (DCF) analysis suggests Reynolds Consumer Products is undervalued by 50.4%. Track this in your watchlist or portfolio, or discover more undervalued stocks.
Approach 2: Reynolds Consumer Products Price vs Earnings
For consistently profitable companies like Reynolds Consumer Products, the Price-to-Earnings (PE) ratio is often the preferred metric for valuing shares. This ratio tells us how much investors are willing to pay for each dollar of a company's earnings, making it an effective gauge of whether a stock is expensive or attractively priced compared to its profits.
A "normal" or "fair" PE ratio depends on growth expectations and risk. Companies expected to deliver higher earnings growth or those seen as less risky typically command higher PE ratios. In contrast, slower growth or riskier companies trade at lower multiples.
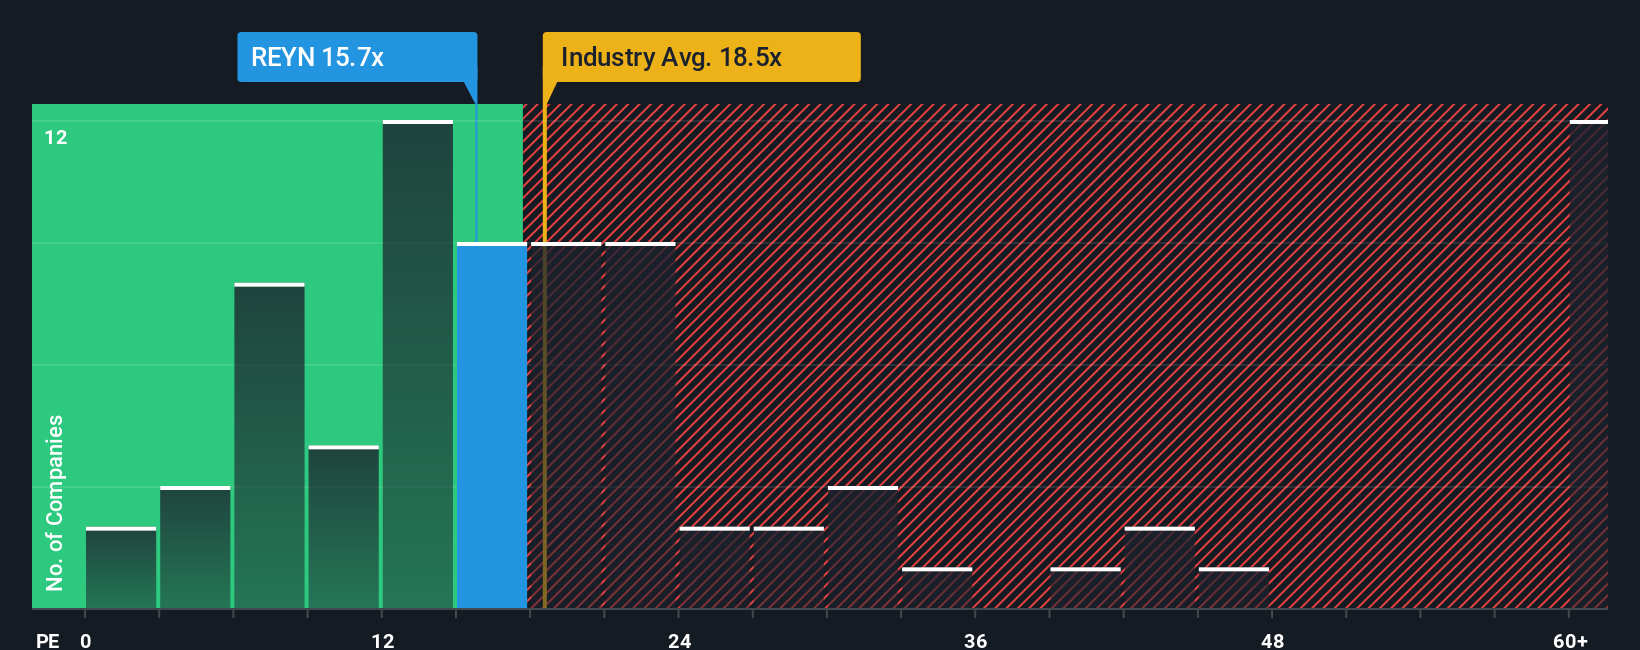
Right now, Reynolds trades at a PE ratio of 16.6x. For comparison, the industry average in Household Products sits at 18.8x, and similar peers average about 17.6x. On paper, that makes Reynolds look slightly less expensive than its competitors.
Here, Simply Wall St’s proprietary “Fair Ratio” comes into play. The Fair Ratio for Reynolds is calculated at 18.5x, which factors in nuances like the company’s future earnings growth, profit margins, size, sector norms, and risk profile. Unlike broad peer or industry averages, the Fair Ratio gives a more precise benchmark tailored for Reynolds’ specific circumstances.
With Reynolds’ actual PE ratio (16.6x) sitting a bit below its Fair Ratio (18.5x), the shares appear modestly undervalued by this measure. While the discount is not dramatic, it does suggest there could be some upside if the company delivers on its expected performance.
Result: UNDERVALUED
PE ratios tell one story, but what if the real opportunity lies elsewhere? Discover companies where insiders are betting big on explosive growth.
Upgrade Your Decision Making: Choose your Reynolds Consumer Products Narrative
Earlier we mentioned there is an even better way to understand valuation, so let’s introduce you to Narratives. Narratives are a simple yet powerful tool that lets you attach a story to the numbers. This means you can add your perspective on Reynolds Consumer Products’ future, including your assumptions about its fair value, revenue, earnings, and margins. By linking the company's story directly to a forward-looking forecast and calculated fair value, Narratives bridge the gap between market data and personal conviction. This helps you see not just where the numbers are, but why they matter.
Available right on Simply Wall St’s Community page, Narratives are designed to be accessible to every investor and are updated in real time as news, earnings, or sector trends emerge. Narratives help you decide when to buy or sell by comparing your Fair Value to the current market Price, making investment decisions clearer and more personalized.
For example, one investor’s Narrative might focus on sustainable innovation and project a fair value as high as $30.00. Another investor, viewing the same risks and trends more cautiously, might set theirs at $22.00. With Narratives, you can instantly reflect your own outlook, see how it stacks up against the community, and respond confidently as new information becomes available.
Do you think there's more to the story for Reynolds Consumer Products? Create your own Narrative to let the Community know!
This article by Simply Wall St is general in nature. We provide commentary based on historical data and analyst forecasts only using an unbiased methodology and our articles are not intended to be financial advice. It does not constitute a recommendation to buy or sell any stock, and does not take account of your objectives, or your financial situation. We aim to bring you long-term focused analysis driven by fundamental data. Note that our analysis may not factor in the latest price-sensitive company announcements or qualitative material. Simply Wall St has no position in any stocks mentioned.
New: AI Stock Screener & Alerts
Our new AI Stock Screener scans the market every day to uncover opportunities.
• Dividend Powerhouses (3%+ Yield)
• Undervalued Small Caps with Insider Buying
• High growth Tech and AI Companies
Or build your own from over 50 metrics.
Have feedback on this article? Concerned about the content? Get in touch with us directly. Alternatively, email editorial-team@simplywallst.com
About NasdaqGS:REYN
Reynolds Consumer Products
Produces and sells products in cooking, waste and storage, and tableware product categories in the United States and internationally.
Undervalued with adequate balance sheet.
Similar Companies
Market Insights

Advertisement
Community Narratives
The Next Phase of Energy Storage: How NeoVolta Is Tackling America’s Power Crunch
Fair Value US$7.50|35.1% undervalued
MA
Community Contributor
Why EnSilica is Worth Possibly 13x its Current Price
Fair Value UK£5.00|89.8% undervalued
DO
Community Contributor
M&A Activity, Industry Diversification & A Defense Contract Monopoly Will Push BWXT For Healthy Long-Term Growth
Fair Value US$220.00|15.2% undervalued
CL
Community Contributor
A case for Cassiar Gold Corp (TSXV: GLDC) to reach CAD$8-10 before 2030 (X30-37)
Fair Value CA$10.00|96.0% undervalued
AG
Community Contributor