Advertisement
- United States
- /
- Household Products
- /
- NasdaqGS:KMB
Does Kimberly-Clark’s Recent Share Price Slide Signal an Opportunity in 2025?

Simply Wall St
Reviewed by Bailey Pemberton
If you are weighing what to do with Kimberly-Clark stock right now, you are definitely not alone. Investors have seen the company move both up and down this year, and it is only natural to wonder if today’s price is offering true value or just business as usual. The stock has edged up just 0.2% over the past week, but zooming out, the last month and year highlight that it has been a rocky ride. Kimberly-Clark is down 4.4% over the past 30 days and a notable 14.7% in the past 12 months. Yet, if you are a longer-term investor, there is still growth to point to. Shares are up 16.5% over three years, even though the stock is slightly down over five.
Major market shifts have certainly played a role in this journey, especially as investors adjusted expectations around consumer staples and interest rates. The result is a company that now looks more interesting by classic value measures. Specifically, Kimberly-Clark scores a 4 out of 6 on our valuation score, indicating it could be undervalued right now in key ways.
So is Kimberly-Clark a well-priced opportunity or simply a reflection of the current market’s uncertainty? Let’s dig into what the numbers reveal about its valuation, before I share an approach that goes beyond the usual checklist and could make a real difference in how you decide what is next.
Why Kimberly-Clark is lagging behind its peers
Approach 1: Kimberly-Clark Discounted Cash Flow (DCF) Analysis
The Discounted Cash Flow (DCF) model estimates the value of a company by projecting its future cash flows and discounting them back to today’s value. This approach aims to answer a core question: “How much are all future cash flows from Kimberly-Clark worth in today's dollars?”
Looking at Kimberly-Clark, the company’s latest twelve-month Free Cash Flow stands at $2.1 billion. Analysts supply forecasts for several years out, estimating a Free Cash Flow of around $2.2 billion in 2026 and $2.05 billion in 2027, both in USD. Beyond these analyst estimates, future cash flows are extrapolated based on plausible growth rates up to 2035, with projections reaching approximately $2.14 billion in 2035.
The DCF model calculates an intrinsic value per share of $137.05, which is about 12.5% higher than the company’s current share price. This indicates Kimberly-Clark is currently undervalued by the DCF model and highlights possible upside for investors who have confidence in its long-term cash generation.
Result: UNDERVALUED
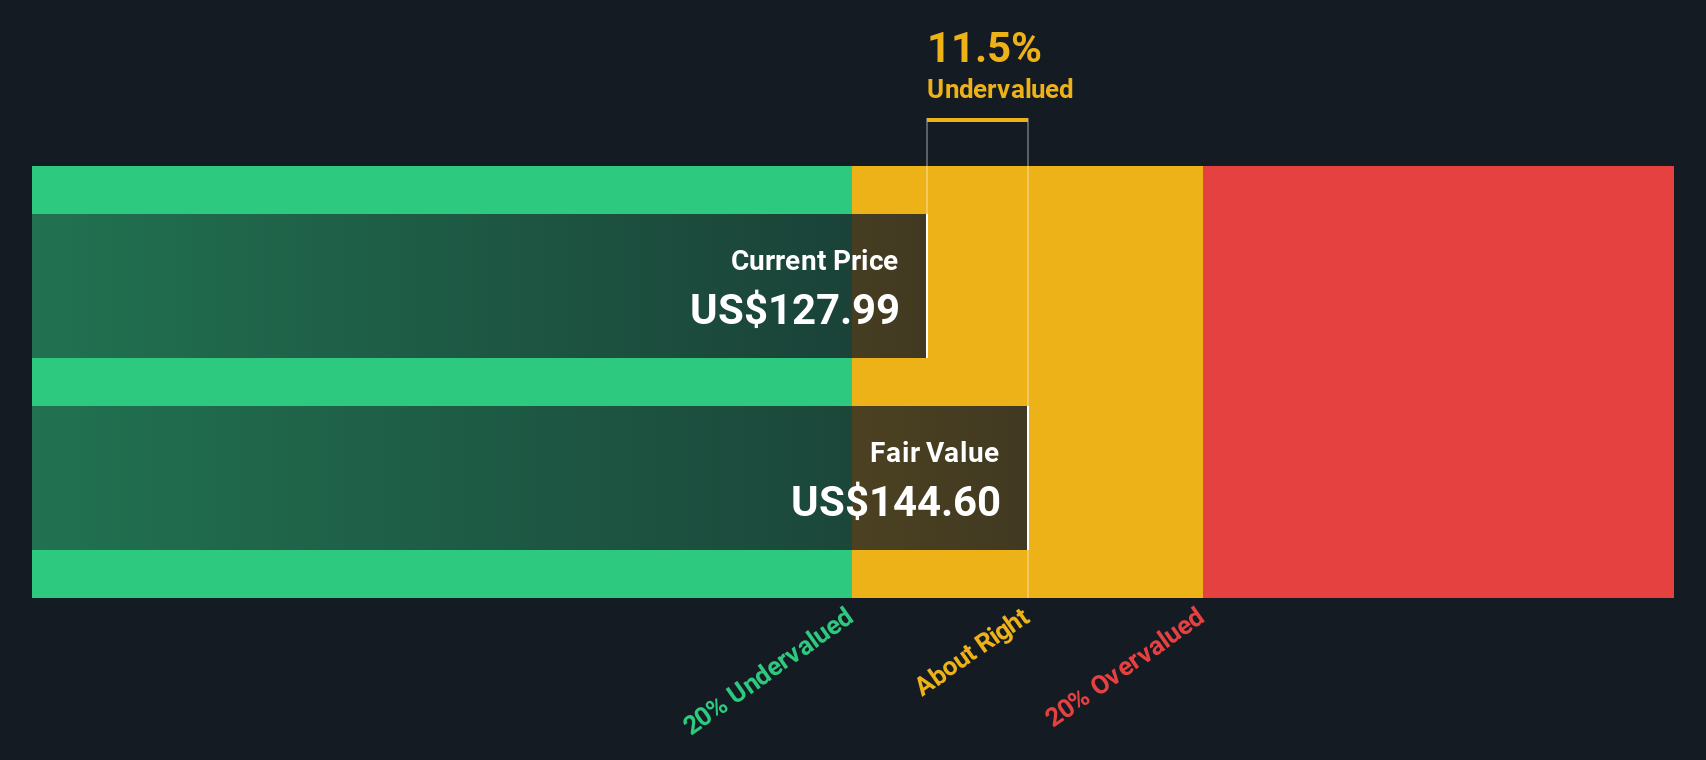
Our Discounted Cash Flow (DCF) analysis suggests Kimberly-Clark is undervalued by 12.5%. Track this in your watchlist or portfolio, or discover more undervalued stocks.
Approach 2: Kimberly-Clark Price vs Earnings
The Price-to-Earnings (PE) ratio is a popular way to value profitable companies like Kimberly-Clark because it connects a business’s stock price directly to its bottom-line earnings. For investors, the PE ratio serves as a quick reference point. A higher ratio generally signals that the market expects more growth, while a lower ratio can reflect more uncertainty or risk.
Growth expectations and risk play crucial roles in what makes a “normal” or “fair” PE for any particular company. Firms with stronger outlooks or safer business models typically command higher PE ratios since investors are willing to pay more for each dollar of profit. By contrast, if profits are stagnating or a business faces headwinds, the market will apply a discount and the PE ratio will fall.
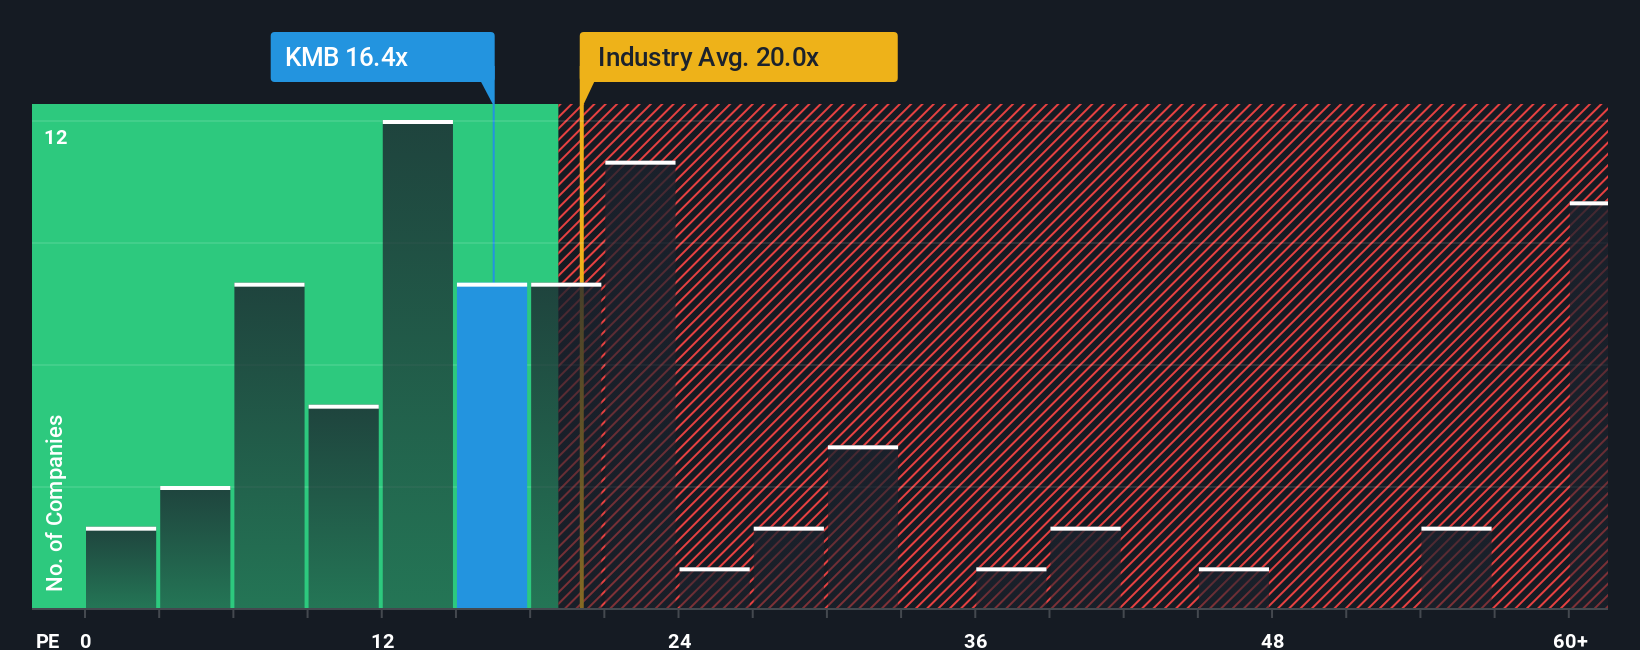
Kimberly-Clark currently trades on a PE ratio of 16.2x. That is noticeably below the peer average of 23.9x as well as the broader industry average of 18.3x for household products. At first glance, this suggests that the market is pricing in less growth or more risk for Kimberly-Clark compared to its competitors.
This is where the “Fair Ratio” from Simply Wall St comes in. Unlike industry averages or peer multiples, the Fair Ratio is customized to Kimberly-Clark and reflects relevant factors such as its expected earnings growth, risk profile, profit margin, market capitalization and sector dynamics. For Kimberly-Clark, the Fair Ratio stands at 21.3x, providing a more precise benchmark for fair value than a simple industry or peer comparison.
Comparing the current PE of 16.2x to the Fair Ratio of 21.3x, Kimberly-Clark is trading at a meaningful discount. This signals that the stock is undervalued by this measure, as investors are paying less than would typically be considered fair given the company’s overall financial health and prospects.
Result: UNDERVALUED
PE ratios tell one story, but what if the real opportunity lies elsewhere? Discover companies where insiders are betting big on explosive growth.
Upgrade Your Decision Making: Choose your Kimberly-Clark Narrative
Earlier, we mentioned that there is an even better way to make sense of valuation, so let’s introduce Narratives. A Narrative is simply your investment story for a company, linking its business outlook and context to a set of financial assumptions like future revenue, earnings, and margins. It is a powerful way to go beyond the numbers, because it starts with what you believe about the company’s future, turns that into a personalized forecast, and then calculates a fair value from your perspective.
Narratives on Simply Wall St make this process easy and accessible for everyone, right within the Community page where millions of investors share their views. Instead of just accepting analyst estimates or peer comparisons, you can create and compare different Narratives, each with its own set of assumptions and fair value. This allows you to quickly spot if there is a disconnect between your fair value and today’s share price, helping you decide if now is the right time to buy, hold, or sell.
What is more, Narratives are updated dynamically when new information is released, so your view and fair value will always reflect the most recent data, not just static past estimates. For example, with Kimberly-Clark, one investor’s optimistic Narrative pegs fair value at $162 per share due to premium product growth and margin gains, while a more cautious investor might see just $118 per share based on concerns about slowing demand and competition: your outlook, your fair value.
Do you think there's more to the story for Kimberly-Clark? Create your own Narrative to let the Community know!

This article by Simply Wall St is general in nature. We provide commentary based on historical data and analyst forecasts only using an unbiased methodology and our articles are not intended to be financial advice. It does not constitute a recommendation to buy or sell any stock, and does not take account of your objectives, or your financial situation. We aim to bring you long-term focused analysis driven by fundamental data. Note that our analysis may not factor in the latest price-sensitive company announcements or qualitative material. Simply Wall St has no position in any stocks mentioned.
Valuation is complex, but we're here to simplify it.
Discover if Kimberly-Clark might be undervalued or overvalued with our detailed analysis, featuring fair value estimates, potential risks, dividends, insider trades, and its financial condition.
Access Free AnalysisHave feedback on this article? Concerned about the content? Get in touch with us directly. Alternatively, email editorial-team@simplywallst.com
About NasdaqGS:KMB
Kimberly-Clark
Manufactures and markets personal care products in the United States.
Solid track record established dividend payer.
Similar Companies
Market Insights

Advertisement
Community Narratives
A formidable player in AI and enterprise computing.
Fair Value US$210.00|13.6% overvalued
CO
Community Contributor
IREN's Bold Moves in Sustainable Bitcoin Mining & AI Data Centers
Fair Value US$89.00|23.6% undervalued
BL
Community Contributor
Cooling the Champions: The Aussie Tech Behind F1's Victories
Fair Value AU$12.40|37.6% undervalued
TR
Community Contributor