Advertisement
- United States
- /
- Medical Equipment
- /
- NYSE:SYK
Are Stryker Shares Fully Priced After Strong Device Sales and Recent FDA Approvals?

Simply Wall St
Reviewed by Simply Wall St
If you are trying to decide what to do with Stryker stock right now, you are not alone. The company’s shares have had a busy year, climbing more than 10% over the past 12 months and sitting up over 72% year to date. That is impressive, especially considering a recent dip over the past month and an overall return of more than 100% over five years. Stryker’s ability to consistently generate revenue growth and boost its bottom line has kept investors interested, even while the broader healthcare sector has faced its own set of challenges.
What is driving all this movement? Recent market optimism about medical device demand, combined with Stryker’s solid revenue and net income growth, has helped support the current share price. Still, some investors are wondering if all the good news is already reflected, especially with the stock trading at a slight discount to analyst price targets but a notable premium compared to certain intrinsic value models. In terms of straightforward numbers, Stryker comes in with a value score of 0 out of 6 when it comes to being undervalued. That means every common valuation check finds the stock fairly or fully priced.
To really get a grip on whether Stryker is worth your hard-earned money, it pays to dig into what these valuation methods are actually saying. It is also worthwhile to consider whether there is a better way to judge a company’s true value. Let us break down the major valuation approaches first, then share a fresh perspective that might change how you look at Stryker altogether.
Stryker delivered 10.7% returns over the last year. See how this stacks up to the rest of the Medical Equipment industry.Approach 1: Stryker Cash Flows
The discounted cash flow (DCF) model estimates a company’s value by forecasting its future cash flows and then discounting them back to today’s dollars. This method aims to capture what a business is really worth based on what it can actually earn.
Stryker’s latest reported free cash flow is $4.0 billion, and forecasts suggest it could reach about $8.2 billion annually within ten years. These projections are based on a blend of analyst estimates and moderate annual growth assumptions, which suggest healthy, consistent improvement in Stryker's ability to generate real cash.
Using the projected cash flow figures and discounting them according to the standard two-stage equity model produces an intrinsic value estimate of $338.60 per share. When compared to Stryker’s current share price, this indicates the stock is roughly 13.7% overvalued by this metric, as the DCF discount is -13.7%. This suggests the market currently prices in considerable optimism about future growth.
Result: OVERVALUED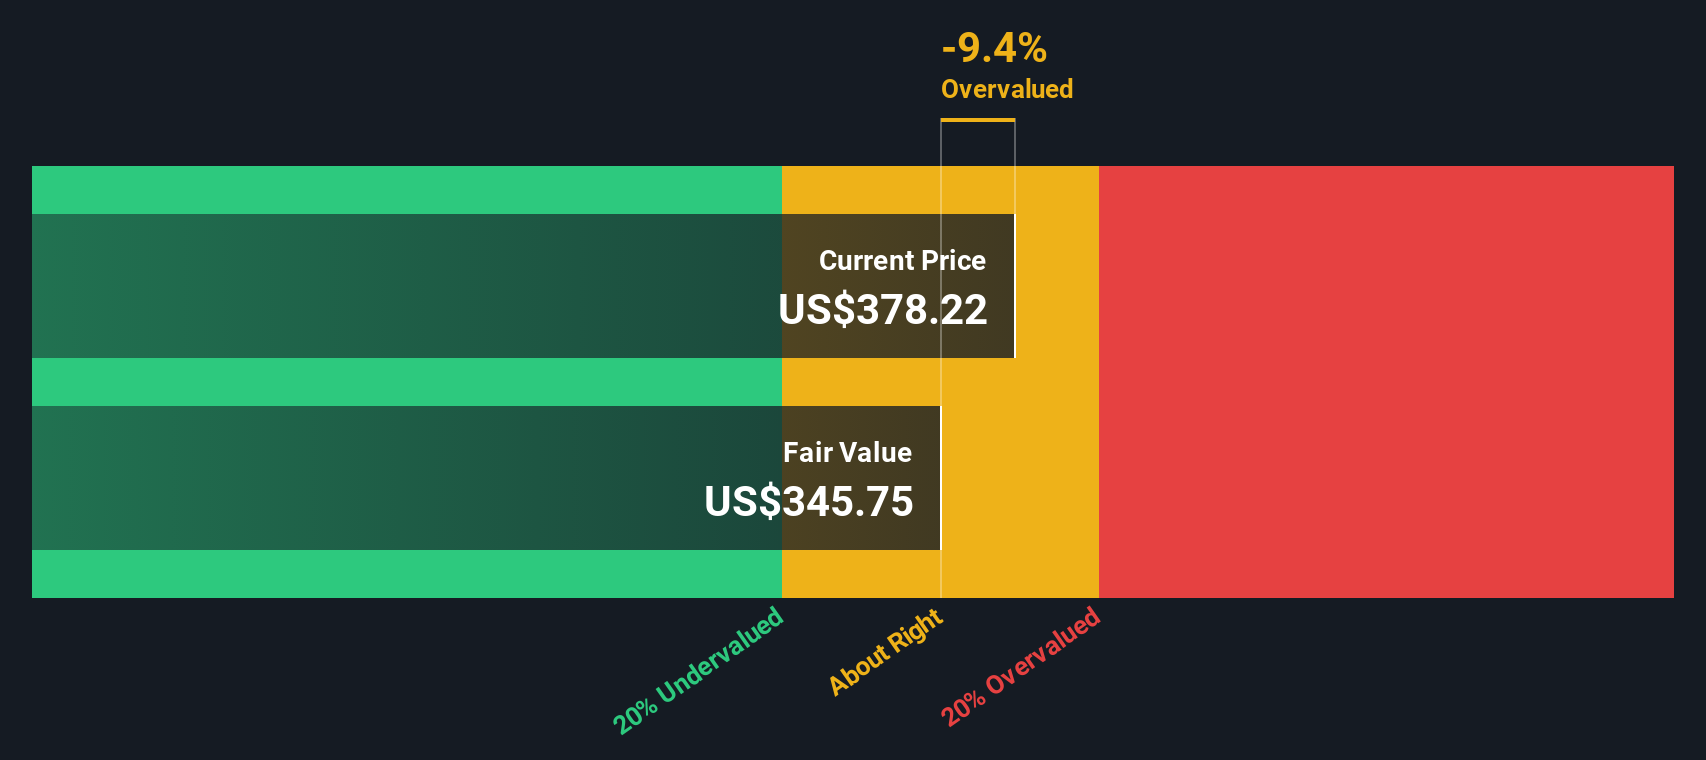
Approach 2: Stryker Price vs Earnings
For established, profitable companies like Stryker, the Price-to-Earnings (PE) ratio is a widely trusted valuation method. The PE ratio helps investors quickly gauge how much they are paying for each dollar of current earnings and offers a sense of whether the stock is cheap or expensive relative to profit.
What counts as a “normal” or “fair” PE ratio depends on expectations for growth and perceived business risk. Generally, higher growth prospects or lower risk justify a higher PE, while slower growers or riskier firms trade for less.
Stryker’s current PE ratio is 50.42x, which is notably higher than the Medical Equipment industry average of 27.75x and its peer group average of 42.09x. However, Simply Wall St's proprietary Fair Ratio for Stryker is 36.05x, which considers company-specific traits such as earnings growth and overall risk profile.
Comparing Stryker’s actual PE ratio of 50.42x to the Fair Ratio of 36.05x shows that the stock trades at a sizeable premium to what would typically be warranted by its fundamentals.
Result: OVERVALUED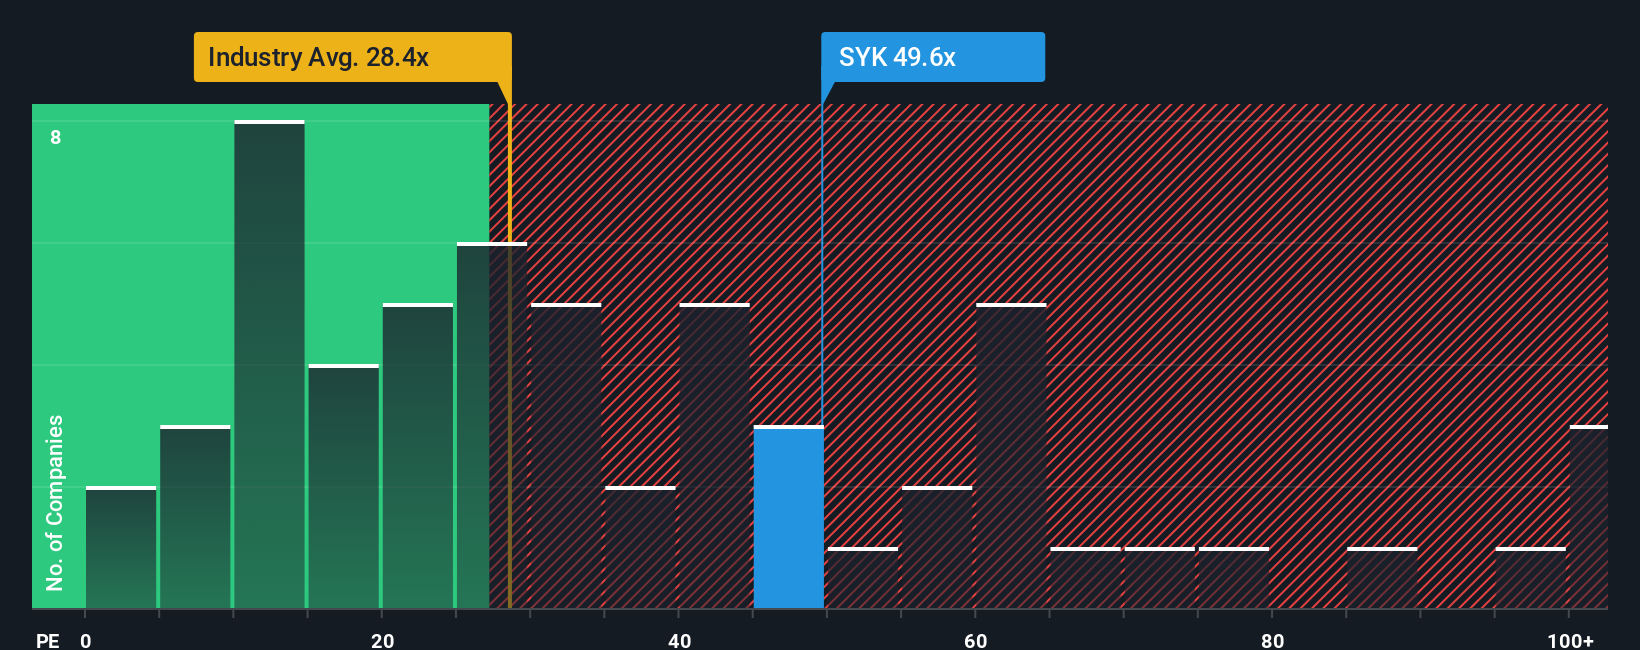
Upgrade Your Decision Making: Choose your Stryker Narrative
Rather than just relying on numerical valuation models, you can use a Narrative—your own story about Stryker—to connect the company’s strategy, industry tailwinds, and risks with what you think its future results will look like.
A Narrative combines your perspective on Stryker, such as beliefs about aging populations or new medical innovations, with estimated numbers for its future revenue, earnings, and margins. This links your story directly to a fair value for the stock.
With Simply Wall St, building and updating your Narrative is easy and intuitive. You can reference ideas from millions of other investors in the community to discover fresh angles or quickly stress-test your assumptions.
This approach helps you make buy or sell decisions by allowing you to compare your own calculation of Fair Value, shaped by your Narrative, with the current market price. Because Narratives are updated dynamically as new developments happen, your investment view automatically stays relevant when the facts change.
For example, some Stryker Narratives expect earnings to climb as high as $6.1 billion and price targets up to $465 based on breakthrough device launches and expansion in emerging markets. More cautious investors forecast earnings near $4.5 billion and targets as low as $316 if regulatory hurdles and pricing pressures slow growth.
Do you think there's more to the story for Stryker? Create your own Narrative to let the Community know!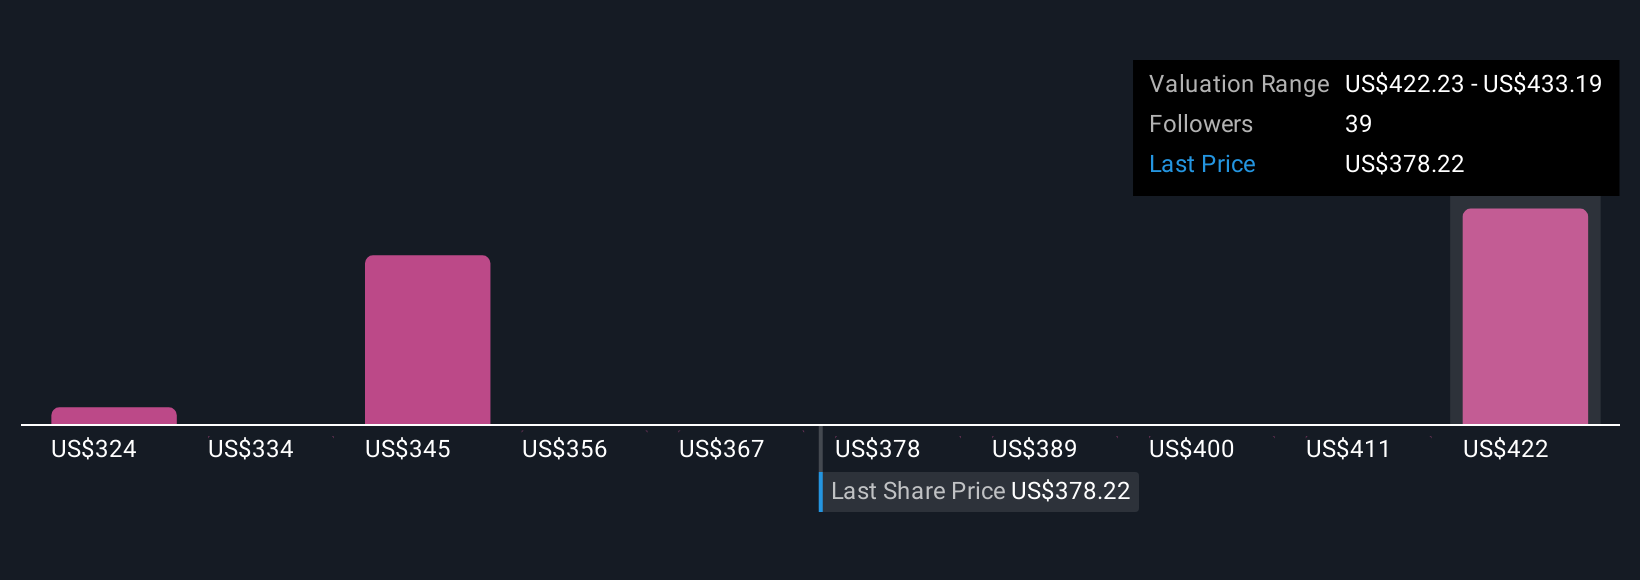
This article by Simply Wall St is general in nature. We provide commentary based on historical data and analyst forecasts only using an unbiased methodology and our articles are not intended to be financial advice. It does not constitute a recommendation to buy or sell any stock, and does not take account of your objectives, or your financial situation. We aim to bring you long-term focused analysis driven by fundamental data. Note that our analysis may not factor in the latest price-sensitive company announcements or qualitative material. Simply Wall St has no position in any stocks mentioned.
New: Manage All Your Stock Portfolios in One Place
We've created the ultimate portfolio companion for stock investors, and it's free.
• Connect an unlimited number of Portfolios and see your total in one currency
• Be alerted to new Warning Signs or Risks via email or mobile
• Track the Fair Value of your stocks
Have feedback on this article? Concerned about the content? Get in touch with us directly. Alternatively, email editorial-team@simplywallst.com
About NYSE:SYK
Adequate balance sheet average dividend payer.
Similar Companies
Market Insights

Advertisement
Community Narratives
America Wants Homegrown Drones — Draganfly Is Ready to Deliver
Fair Value US$9.21|28.9% undervalued
JO
Community Contributor
Cheesecake Factory offers an enticing opportunity for long-term growth by leveraging new concepts
Fair Value US$73.83|27.0% undervalued
ZW
Community Contributor
Coca-Cola’s Intrinsic Value Set to Rise with Fed Rate Cut
Fair Value US$67.50|1.9% undervalued
AL
Community Contributor
Fully Permitted Gold Mine with 50 Baggers Potential 
Fair Value CA$41.00|98.5% undervalued
RO
Community Contributor