- United States
- /
- Medical Equipment
- /
- NasdaqCM:ZJYL
Jin Medical International Ltd. (NASDAQ:ZJYL) Shares May Have Slumped 27% But Getting In Cheap Is Still Unlikely


To the annoyance of some shareholders, Jin Medical International Ltd. (NASDAQ:ZJYL) shares are down a considerable 27% in the last month, which continues a horrid run for the company. Nonetheless, the last 30 days have barely left a scratch on the stock's annual performance, which is up a whopping 692%.
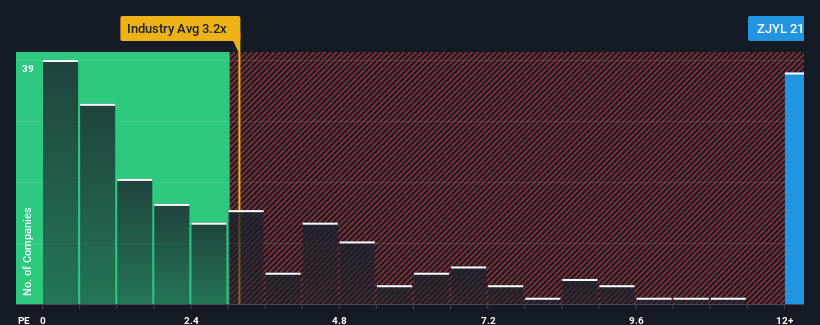
In spite of the heavy fall in price, you could still be forgiven for thinking Jin Medical International is a stock to steer clear of with a price-to-sales ratios (or "P/S") of 21x, considering almost half the companies in the United States' Medical Equipment industry have P/S ratios below 3.2x. Nonetheless, we'd need to dig a little deeper to determine if there is a rational basis for the highly elevated P/S.
Check out our latest analysis for Jin Medical International
How Has Jin Medical International Performed Recently?
The recent revenue growth at Jin Medical International would have to be considered satisfactory if not spectacular. One possibility is that the P/S ratio is high because investors think this good revenue growth will be enough to outperform the broader industry in the near future. However, if this isn't the case, investors might get caught out paying too much for the stock.
Want the full picture on earnings, revenue and cash flow for the company? Then our free report on Jin Medical International will help you shine a light on its historical performance.How Is Jin Medical International's Revenue Growth Trending?
There's an inherent assumption that a company should far outperform the industry for P/S ratios like Jin Medical International's to be considered reasonable.
If we review the last year of revenue growth, the company posted a worthy increase of 3.3%. Revenue has also lifted 22% in aggregate from three years ago, partly thanks to the last 12 months of growth. So we can start by confirming that the company has actually done a good job of growing revenue over that time.
Comparing the recent medium-term revenue trends against the industry's one-year growth forecast of 9.5% shows it's noticeably less attractive.
In light of this, it's alarming that Jin Medical International's P/S sits above the majority of other companies. It seems most investors are ignoring the fairly limited recent growth rates and are hoping for a turnaround in the company's business prospects. There's a good chance existing shareholders are setting themselves up for future disappointment if the P/S falls to levels more in line with recent growth rates.
What We Can Learn From Jin Medical International's P/S?
A significant share price dive has done very little to deflate Jin Medical International's very lofty P/S. Using the price-to-sales ratio alone to determine if you should sell your stock isn't sensible, however it can be a practical guide to the company's future prospects.
Our examination of Jin Medical International revealed its poor three-year revenue trends aren't detracting from the P/S as much as we though, given they look worse than current industry expectations. Right now we aren't comfortable with the high P/S as this revenue performance isn't likely to support such positive sentiment for long. If recent medium-term revenue trends continue, it will place shareholders' investments at significant risk and potential investors in danger of paying an excessive premium.
There are also other vital risk factors to consider before investing and we've discovered 2 warning signs for Jin Medical International that you should be aware of.
If strong companies turning a profit tickle your fancy, then you'll want to check out this free list of interesting companies that trade on a low P/E (but have proven they can grow earnings).
If you're looking to trade Jin Medical International, open an account with the lowest-cost platform trusted by professionals, Interactive Brokers.
With clients in over 200 countries and territories, and access to 160 markets, IBKR lets you trade stocks, options, futures, forex, bonds and funds from a single integrated account.
Enjoy no hidden fees, no account minimums, and FX conversion rates as low as 0.03%, far better than what most brokers offer.
Sponsored ContentNew: Manage All Your Stock Portfolios in One Place
We've created the ultimate portfolio companion for stock investors, and it's free.
• Connect an unlimited number of Portfolios and see your total in one currency
• Be alerted to new Warning Signs or Risks via email or mobile
• Track the Fair Value of your stocks
Have feedback on this article? Concerned about the content? Get in touch with us directly. Alternatively, email editorial-team (at) simplywallst.com.
This article by Simply Wall St is general in nature. We provide commentary based on historical data and analyst forecasts only using an unbiased methodology and our articles are not intended to be financial advice. It does not constitute a recommendation to buy or sell any stock, and does not take account of your objectives, or your financial situation. We aim to bring you long-term focused analysis driven by fundamental data. Note that our analysis may not factor in the latest price-sensitive company announcements or qualitative material. Simply Wall St has no position in any stocks mentioned.
About NasdaqCM:ZJYL
Jin Medical International
Engages in the design, development, manufacture, and sale of wheelchair and other living aids products for people with disabilities, the elderly, and people recovering from injury.
Proven track record with adequate balance sheet.
