
Advertisement
- United States
- /
- Medical Equipment
- /
- NasdaqCM:ZJYL
Capital Allocation Trends At Jin Medical International (NASDAQ:ZJYL) Aren't Ideal

If we want to find a stock that could multiply over the long term, what are the underlying trends we should look for? Ideally, a business will show two trends; firstly a growing return on capital employed (ROCE) and secondly, an increasing amount of capital employed. If you see this, it typically means it's a company with a great business model and plenty of profitable reinvestment opportunities. In light of that, when we looked at Jin Medical International (NASDAQ:ZJYL) and its ROCE trend, we weren't exactly thrilled.
Return On Capital Employed (ROCE): What Is It?
Just to clarify if you're unsure, ROCE is a metric for evaluating how much pre-tax income (in percentage terms) a company earns on the capital invested in its business. The formula for this calculation on Jin Medical International is:
Return on Capital Employed = Earnings Before Interest and Tax (EBIT) ÷ (Total Assets - Current Liabilities)
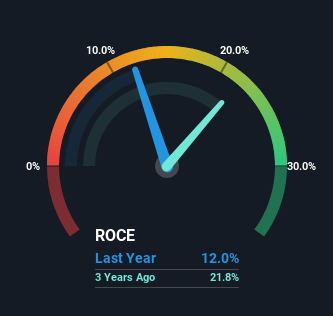
0.12 = US$2.9m ÷ (US$33m - US$8.9m) (Based on the trailing twelve months to September 2023).
So, Jin Medical International has an ROCE of 12%. In absolute terms, that's a pretty normal return, and it's somewhat close to the Medical Equipment industry average of 10%.
Check out our latest analysis for Jin Medical International
While the past is not representative of the future, it can be helpful to know how a company has performed historically, which is why we have this chart above. If you'd like to look at how Jin Medical International has performed in the past in other metrics, you can view this free graph of Jin Medical International's past earnings, revenue and cash flow.
So How Is Jin Medical International's ROCE Trending?
On the surface, the trend of ROCE at Jin Medical International doesn't inspire confidence. Over the last five years, returns on capital have decreased to 12% from 47% five years ago. On the other hand, the company has been employing more capital without a corresponding improvement in sales in the last year, which could suggest these investments are longer term plays. It may take some time before the company starts to see any change in earnings from these investments.
On a related note, Jin Medical International has decreased its current liabilities to 27% of total assets. That could partly explain why the ROCE has dropped. Effectively this means their suppliers or short-term creditors are funding less of the business, which reduces some elements of risk. Some would claim this reduces the business' efficiency at generating ROCE since it is now funding more of the operations with its own money.
In Conclusion...
In summary, Jin Medical International is reinvesting funds back into the business for growth but unfortunately it looks like sales haven't increased much just yet. Investors must think there's better things to come because the stock has knocked it out of the park, delivering a 579% gain to shareholders who have held over the last year. Ultimately, if the underlying trends persist, we wouldn't hold our breath on it being a multi-bagger going forward.
Jin Medical International does have some risks though, and we've spotted 2 warning signs for Jin Medical International that you might be interested in.
While Jin Medical International may not currently earn the highest returns, we've compiled a list of companies that currently earn more than 25% return on equity. Check out this free list here.
New: Manage All Your Stock Portfolios in One Place
We've created the ultimate portfolio companion for stock investors, and it's free.
• Connect an unlimited number of Portfolios and see your total in one currency
• Be alerted to new Warning Signs or Risks via email or mobile
• Track the Fair Value of your stocks
Have feedback on this article? Concerned about the content? Get in touch with us directly. Alternatively, email editorial-team (at) simplywallst.com.
This article by Simply Wall St is general in nature. We provide commentary based on historical data and analyst forecasts only using an unbiased methodology and our articles are not intended to be financial advice. It does not constitute a recommendation to buy or sell any stock, and does not take account of your objectives, or your financial situation. We aim to bring you long-term focused analysis driven by fundamental data. Note that our analysis may not factor in the latest price-sensitive company announcements or qualitative material. Simply Wall St has no position in any stocks mentioned.
Have feedback on this article? Concerned about the content? Get in touch with us directly. Alternatively, email editorial-team@simplywallst.com
About NasdaqCM:ZJYL
Jin Medical International
Engages in the design, development, manufacture, and sale of wheelchair and other living aids products for people with disabilities, the elderly, and people recovering from injury.
Proven track record with adequate balance sheet.
Similar Companies
Market Insights

Advertisement
Community Narratives
Pinterest will surge as advertising innovations ignite revenue growth
Fair Value US$42.63|26.3% undervalued
BR
Community Contributor
Brambles' Revenue Set to Climb 14% with Profit Margins Following
Fair Value AU$21.90|4.9% overvalued
RO
Community Contributor
Challenging Future for STG as Organic Sales Decline by 8.8%
Fair Value DKK 116.13|26.8% undervalued
KA
Community Contributor