
Advertisement
- United States
- /
- Medical Equipment
- /
- NasdaqGS:NEOG
Is There An Opportunity With Neogen Corporation's (NASDAQ:NEOG) 46% Undervaluation?
Key Insights
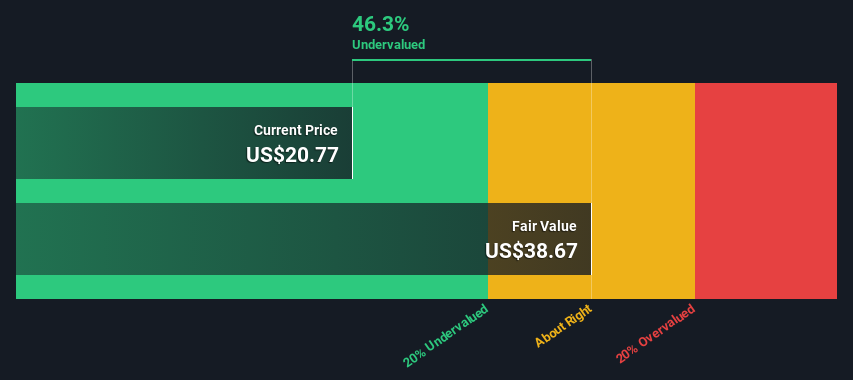
- Neogen's estimated fair value is US$38.67 based on 2 Stage Free Cash Flow to Equity
- Neogen is estimated to be 46% undervalued based on current share price of US$20.77
- Analyst price target for NEOG is US$20.50 which is 47% below our fair value estimate
Today we'll do a simple run through of a valuation method used to estimate the attractiveness of Neogen Corporation (NASDAQ:NEOG) as an investment opportunity by estimating the company's future cash flows and discounting them to their present value. One way to achieve this is by employing the Discounted Cash Flow (DCF) model. There's really not all that much to it, even though it might appear quite complex.
Remember though, that there are many ways to estimate a company's value, and a DCF is just one method. Anyone interested in learning a bit more about intrinsic value should have a read of the Simply Wall St analysis model.
See our latest analysis for Neogen
What's The Estimated Valuation?
We use what is known as a 2-stage model, which simply means we have two different periods of growth rates for the company's cash flows. Generally the first stage is higher growth, and the second stage is a lower growth phase. In the first stage we need to estimate the cash flows to the business over the next ten years. Where possible we use analyst estimates, but when these aren't available we extrapolate the previous free cash flow (FCF) from the last estimate or reported value. We assume companies with shrinking free cash flow will slow their rate of shrinkage, and that companies with growing free cash flow will see their growth rate slow, over this period. We do this to reflect that growth tends to slow more in the early years than it does in later years.
Generally we assume that a dollar today is more valuable than a dollar in the future, so we need to discount the sum of these future cash flows to arrive at a present value estimate:
10-year free cash flow (FCF) estimate
| 2023 | 2024 | 2025 | 2026 | 2027 | 2028 | 2029 | 2030 | 2031 | 2032 | |
| Levered FCF ($, Millions) | -US$89.2m | US$40.4m | US$127.4m | US$213.3m | US$315.5m | US$423.1m | US$526.9m | US$620.7m | US$702.0m | US$770.8m |
| Growth Rate Estimate Source | Analyst x1 | Analyst x1 | Analyst x1 | Est @ 67.46% | Est @ 47.86% | Est @ 34.13% | Est @ 24.53% | Est @ 17.80% | Est @ 13.09% | Est @ 9.80% |
| Present Value ($, Millions) Discounted @ 7.9% | -US$82.6 | US$34.7 | US$101 | US$157 | US$215 | US$268 | US$309 | US$337 | US$353 | US$359 |
("Est" = FCF growth rate estimated by Simply Wall St)
Present Value of 10-year Cash Flow (PVCF) = US$2.1b
The second stage is also known as Terminal Value, this is the business's cash flow after the first stage. The Gordon Growth formula is used to calculate Terminal Value at a future annual growth rate equal to the 5-year average of the 10-year government bond yield of 2.1%. We discount the terminal cash flows to today's value at a cost of equity of 7.9%.
Terminal Value (TV)= FCF2032 × (1 + g) ÷ (r – g) = US$771m× (1 + 2.1%) ÷ (7.9%– 2.1%) = US$14b
Present Value of Terminal Value (PVTV)= TV / (1 + r)10= US$14b÷ ( 1 + 7.9%)10= US$6.3b
The total value, or equity value, is then the sum of the present value of the future cash flows, which in this case is US$8.4b. The last step is to then divide the equity value by the number of shares outstanding. Compared to the current share price of US$20.8, the company appears quite undervalued at a 46% discount to where the stock price trades currently. Remember though, that this is just an approximate valuation, and like any complex formula - garbage in, garbage out.
The Assumptions
We would point out that the most important inputs to a discounted cash flow are the discount rate and of course the actual cash flows. Part of investing is coming up with your own evaluation of a company's future performance, so try the calculation yourself and check your own assumptions. The DCF also does not consider the possible cyclicality of an industry, or a company's future capital requirements, so it does not give a full picture of a company's potential performance. Given that we are looking at Neogen as potential shareholders, the cost of equity is used as the discount rate, rather than the cost of capital (or weighted average cost of capital, WACC) which accounts for debt. In this calculation we've used 7.9%, which is based on a levered beta of 0.979. Beta is a measure of a stock's volatility, compared to the market as a whole. We get our beta from the industry average beta of globally comparable companies, with an imposed limit between 0.8 and 2.0, which is a reasonable range for a stable business.
SWOT Analysis for Neogen
Strength
- Debt is well covered by .
Weakness
- Interest payments on debt are not well covered.
- Shareholders have been diluted in the past year.
Opportunity
- Forecast to reduce losses next year.
- Has sufficient cash runway for more than 3 years based on current free cash flows.
- Trading below our estimate of fair value by more than 20%.
Threat
- Debt is not well covered by operating cash flow.
Looking Ahead:
Valuation is only one side of the coin in terms of building your investment thesis, and it is only one of many factors that you need to assess for a company. DCF models are not the be-all and end-all of investment valuation. Preferably you'd apply different cases and assumptions and see how they would impact the company's valuation. If a company grows at a different rate, or if its cost of equity or risk free rate changes sharply, the output can look very different. Can we work out why the company is trading at a discount to intrinsic value? For Neogen, we've compiled three relevant aspects you should further research:
- Risks: Consider for instance, the ever-present spectre of investment risk. We've identified 1 warning sign with Neogen , and understanding this should be part of your investment process.
- Future Earnings: How does NEOG's growth rate compare to its peers and the wider market? Dig deeper into the analyst consensus number for the upcoming years by interacting with our free analyst growth expectation chart.
- Other Solid Businesses: Low debt, high returns on equity and good past performance are fundamental to a strong business. Why not explore our interactive list of stocks with solid business fundamentals to see if there are other companies you may not have considered!
PS. The Simply Wall St app conducts a discounted cash flow valuation for every stock on the NASDAQGS every day. If you want to find the calculation for other stocks just search here.
Valuation is complex, but we're here to simplify it.
Discover if Neogen might be undervalued or overvalued with our detailed analysis, featuring fair value estimates, potential risks, dividends, insider trades, and its financial condition.
Access Free AnalysisHave feedback on this article? Concerned about the content? Get in touch with us directly. Alternatively, email editorial-team (at) simplywallst.com.
This article by Simply Wall St is general in nature. We provide commentary based on historical data and analyst forecasts only using an unbiased methodology and our articles are not intended to be financial advice. It does not constitute a recommendation to buy or sell any stock, and does not take account of your objectives, or your financial situation. We aim to bring you long-term focused analysis driven by fundamental data. Note that our analysis may not factor in the latest price-sensitive company announcements or qualitative material. Simply Wall St has no position in any stocks mentioned.
About NasdaqGS:NEOG
Neogen
Develops, manufactures, and markets various products and services for food and animal safety in the United States and internationally.
Adequate balance sheet and slightly overvalued.
Similar Companies
Market Insights


Advertisement
Community Narratives
America Wants Homegrown Drones — Draganfly Is Ready to Deliver
Fair Value US$9.21|27.4% undervalued
JO
Community Contributor
Cheesecake Factory offers an enticing opportunity for long-term growth by leveraging new concepts
Fair Value US$73.83|25.8% undervalued
ZW
Community Contributor
Coca-Cola’s Intrinsic Value Set to Rise with Fed Rate Cut
Fair Value US$67.50|2.7% undervalued
AL
Community Contributor
Fully Permitted Gold Mine with 50 Baggers Potential 
Fair Value CA$41.00|98.0% undervalued
RO
Community Contributor