- United States
- /
- Medical Equipment
- /
- NasdaqGS:INMD
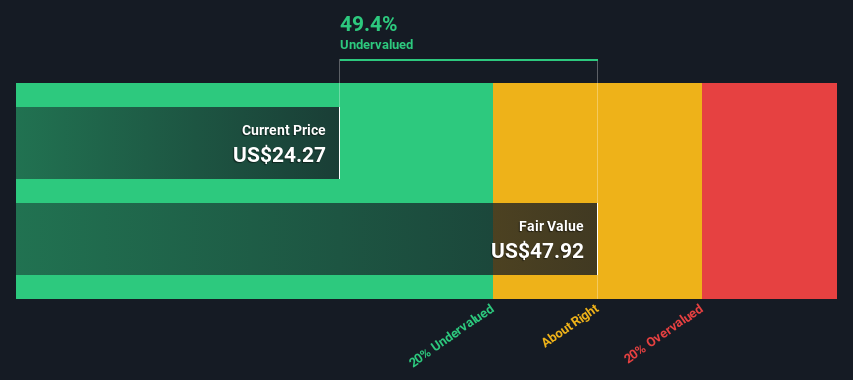
Is InMode Ltd. (NASDAQ:INMD) Trading At A 49% Discount?


Key Insights
- InMode's estimated fair value is US$47.92 based on 2 Stage Free Cash Flow to Equity
- InMode's US$24.27 share price signals that it might be 49% undervalued
- The US$28.00 analyst price target for INMD is 42% less than our estimate of fair value
In this article we are going to estimate the intrinsic value of InMode Ltd. (NASDAQ:INMD) by estimating the company's future cash flows and discounting them to their present value. One way to achieve this is by employing the Discounted Cash Flow (DCF) model. Before you think you won't be able to understand it, just read on! It's actually much less complex than you'd imagine.
Remember though, that there are many ways to estimate a company's value, and a DCF is just one method. Anyone interested in learning a bit more about intrinsic value should have a read of the Simply Wall St analysis model.
View our latest analysis for InMode
Crunching The Numbers
We're using the 2-stage growth model, which simply means we take in account two stages of company's growth. In the initial period the company may have a higher growth rate and the second stage is usually assumed to have a stable growth rate. In the first stage we need to estimate the cash flows to the business over the next ten years. Where possible we use analyst estimates, but when these aren't available we extrapolate the previous free cash flow (FCF) from the last estimate or reported value. We assume companies with shrinking free cash flow will slow their rate of shrinkage, and that companies with growing free cash flow will see their growth rate slow, over this period. We do this to reflect that growth tends to slow more in the early years than it does in later years.
Generally we assume that a dollar today is more valuable than a dollar in the future, so we need to discount the sum of these future cash flows to arrive at a present value estimate:
10-year free cash flow (FCF) estimate
| 2024 | 2025 | 2026 | 2027 | 2028 | 2029 | 2030 | 2031 | 2032 | 2033 | |
| Levered FCF ($, Millions) | US$194.0m | US$209.0m | US$220.4m | US$230.3m | US$239.1m | US$247.1m | US$254.5m | US$261.5m | US$268.3m | US$275.0m |
| Growth Rate Estimate Source | Analyst x1 | Analyst x1 | Est @ 5.46% | Est @ 4.49% | Est @ 3.81% | Est @ 3.33% | Est @ 3.00% | Est @ 2.77% | Est @ 2.60% | Est @ 2.49% |
| Present Value ($, Millions) Discounted @ 7.8% | US$180 | US$180 | US$176 | US$171 | US$164 | US$158 | US$151 | US$144 | US$137 | US$130 |
("Est" = FCF growth rate estimated by Simply Wall St)
Present Value of 10-year Cash Flow (PVCF) = US$1.6b
The second stage is also known as Terminal Value, this is the business's cash flow after the first stage. The Gordon Growth formula is used to calculate Terminal Value at a future annual growth rate equal to the 5-year average of the 10-year government bond yield of 2.2%. We discount the terminal cash flows to today's value at a cost of equity of 7.8%.
Terminal Value (TV)= FCF2033 × (1 + g) ÷ (r – g) = US$275m× (1 + 2.2%) ÷ (7.8%– 2.2%) = US$5.1b
Present Value of Terminal Value (PVTV)= TV / (1 + r)10= US$5.1b÷ ( 1 + 7.8%)10= US$2.4b
The total value, or equity value, is then the sum of the present value of the future cash flows, which in this case is US$4.0b. To get the intrinsic value per share, we divide this by the total number of shares outstanding. Relative to the current share price of US$24.3, the company appears quite undervalued at a 49% discount to where the stock price trades currently. Remember though, that this is just an approximate valuation, and like any complex formula - garbage in, garbage out.
Important Assumptions
The calculation above is very dependent on two assumptions. The first is the discount rate and the other is the cash flows. You don't have to agree with these inputs, I recommend redoing the calculations yourself and playing with them. The DCF also does not consider the possible cyclicality of an industry, or a company's future capital requirements, so it does not give a full picture of a company's potential performance. Given that we are looking at InMode as potential shareholders, the cost of equity is used as the discount rate, rather than the cost of capital (or weighted average cost of capital, WACC) which accounts for debt. In this calculation we've used 7.8%, which is based on a levered beta of 0.914. Beta is a measure of a stock's volatility, compared to the market as a whole. We get our beta from the industry average beta of globally comparable companies, with an imposed limit between 0.8 and 2.0, which is a reasonable range for a stable business.
SWOT Analysis for InMode
- Currently debt free.
- Earnings growth over the past year underperformed the Medical Equipment industry.
- Annual earnings are forecast to grow for the next 4 years.
- Good value based on P/E ratio and estimated fair value.
- Annual earnings are forecast to grow slower than the American market.
Looking Ahead:
Valuation is only one side of the coin in terms of building your investment thesis, and it shouldn't be the only metric you look at when researching a company. The DCF model is not a perfect stock valuation tool. Instead the best use for a DCF model is to test certain assumptions and theories to see if they would lead to the company being undervalued or overvalued. If a company grows at a different rate, or if its cost of equity or risk free rate changes sharply, the output can look very different. What is the reason for the share price sitting below the intrinsic value? For InMode, we've put together three essential factors you should further research:
- Risks: For example, we've discovered 1 warning sign for InMode that you should be aware of before investing here.
- Future Earnings: How does INMD's growth rate compare to its peers and the wider market? Dig deeper into the analyst consensus number for the upcoming years by interacting with our free analyst growth expectation chart.
- Other Solid Businesses: Low debt, high returns on equity and good past performance are fundamental to a strong business. Why not explore our interactive list of stocks with solid business fundamentals to see if there are other companies you may not have considered!
PS. Simply Wall St updates its DCF calculation for every American stock every day, so if you want to find the intrinsic value of any other stock just search here.
New: AI Stock Screener & Alerts
Our new AI Stock Screener scans the market every day to uncover opportunities.
• Dividend Powerhouses (3%+ Yield)
• Undervalued Small Caps with Insider Buying
• High growth Tech and AI Companies
Or build your own from over 50 metrics.
Have feedback on this article? Concerned about the content? Get in touch with us directly. Alternatively, email editorial-team (at) simplywallst.com.
This article by Simply Wall St is general in nature. We provide commentary based on historical data and analyst forecasts only using an unbiased methodology and our articles are not intended to be financial advice. It does not constitute a recommendation to buy or sell any stock, and does not take account of your objectives, or your financial situation. We aim to bring you long-term focused analysis driven by fundamental data. Note that our analysis may not factor in the latest price-sensitive company announcements or qualitative material. Simply Wall St has no position in any stocks mentioned.
About NasdaqGS:INMD
InMode
Designs, develops, manufactures, and markets minimally invasive aesthetic medical products based on its proprietary radiofrequency assisted lipolysis and deep subdermal fractional radiofrequency technologies in the United States and internationally.
Flawless balance sheet and undervalued.
Similar Companies
Market Insights

Community Narratives
