Advertisement
- United States
- /
- Medical Equipment
- /
- NasdaqGS:HOLX
Does Hologic’s Share Price Offer Opportunity Following Recent Q2 Earnings Report?

Simply Wall St
Reviewed by Bailey Pemberton
If you’re sitting on the fence about what to do with Hologic stock, you’re in good company. Lately, the stock price has shown a steady hand, not making any dramatic swings but quietly inching forward with a 0.4% gain over the last week and a 1.5% climb this month. That’s after a challenging year, with the stock down nearly 16% over the past twelve months and off 5.6% since the start of the year. Looking further back reveals a more nuanced picture, with a modest 9.3% return over the last three years and just a hair above break-even in the last five years.
What’s driving this recent stability, and is there room for optimism? Market watchers point to shifts in health sector sentiment and changing risk appetites among investors, which can recalibrate expectations quickly for specialty medical companies like Hologic. While some competitors have experienced sharper rebounds, Hologic’s steady performance has kept risk in check for cautious investors. That’s where valuation comes in. The key question is whether the fundamentals make the case for an attractive buy, or if the market is already pricing things perfectly.
To answer that, let’s look at the numbers. On a typical value checklist with six criteria for identifying undervalued companies, Hologic scores a strong 5. That suggests there may be reasons for optimism, even if the headlines haven’t reflected this yet. Let’s break down how Hologic stacks up across a range of valuation approaches. And stick around to the end, because there’s an even smarter way to cut through the noise and see what the numbers are really telling us.
Why Hologic is lagging behind its peers
Approach 1: Hologic Discounted Cash Flow (DCF) Analysis
The Discounted Cash Flow (DCF) model estimates a company's intrinsic value by forecasting its future cash flows and discounting them back to their present value. This approach helps investors assess whether a stock is trading at a discount or a premium compared to its calculated true worth.
For Hologic, the most recent reported Free Cash Flow is $918.8 million. Analysts provide growth projections for the next few years, but longer-term figures are extrapolated for a ten-year outlook. Based on current estimates and projections, Hologic’s Free Cash Flow is expected to gradually rise, reaching approximately $1.16 billion by 2028 and about $1.5 billion by 2035, all in US dollars.
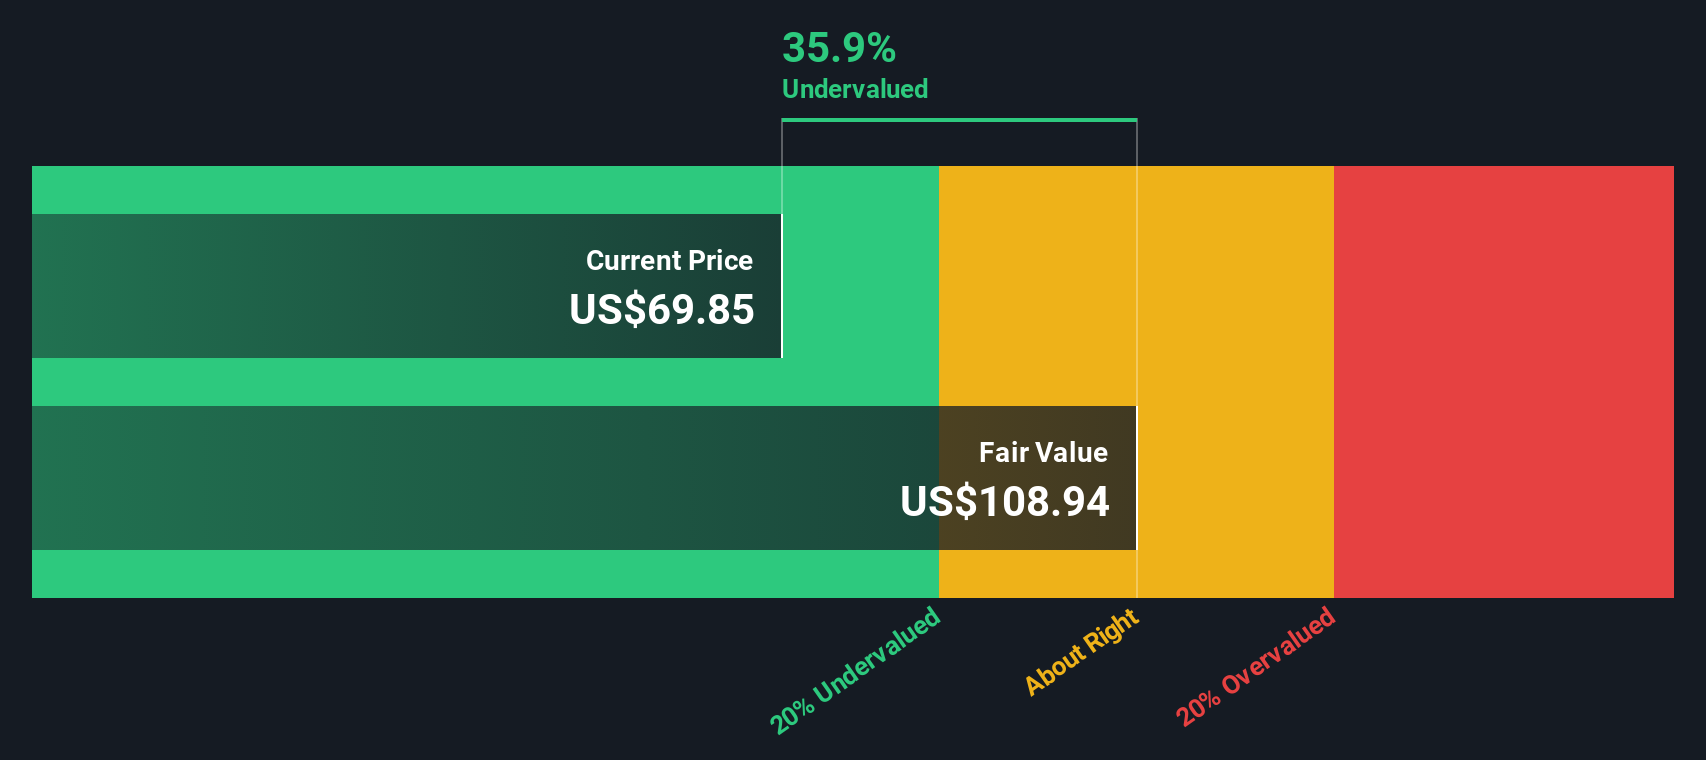
Taking all of this into account, the DCF model generates an estimated intrinsic value of $108.76 per share. According to the analysis, this is about 37.7% higher than Hologic’s current share price. This suggests a significant margin of undervaluation.
Result: UNDERVALUED
Our Discounted Cash Flow (DCF) analysis suggests Hologic is undervalued by 37.7%. Track this in your watchlist or portfolio, or discover more undervalued stocks.
Approach 2: Hologic Price vs Earnings
The Price-to-Earnings (PE) ratio is a favored metric for valuing profitable companies like Hologic because it directly connects a company’s share price with its underlying earnings power. This makes it especially useful for investors wanting to see how much they’re paying for each dollar of profit, an essential consideration when a business is steadily generating income.
What counts as a “normal” or “fair” PE ratio? That depends a lot on market sentiment around future growth and risk. Companies with strong expected earnings growth and lower perceived risk tend to have higher PE ratios, since investors are willing to pay a premium for reliable, expanding profits. Conversely, higher risks or slower growth can compress PE multiples.
Hologic currently trades at a PE ratio of 27x, which is slightly below the medical equipment industry average of 30.6x and markedly below the peer average of 54.9x. Instead of just benchmarking against these simple comparisons, Simply Wall St has developed the “Fair Ratio,” a tailored multiple that accounts for Hologic’s growth outlook, profitability, industry context, risks, and market value. For Hologic, the Fair Ratio calculates to 28.3x, just above its actual multiple. This nuanced benchmark provides a more accurate assessment than standard peer or industry checks, since it is built from the ground up using the stock’s real strengths and vulnerabilities.
Given the extremely close match between the Fair Ratio and Hologic’s current PE, this suggests the stock is valued about right at today’s levels.
Result: ABOUT RIGHT

PE ratios tell one story, but what if the real opportunity lies elsewhere? Discover companies where insiders are betting big on explosive growth.
Upgrade Your Decision Making: Choose your Hologic Narrative
Earlier we mentioned there is an even better way to cut through the noise and understand what the numbers are really telling us, so let’s introduce you to Narratives.
A Narrative is a simple and user-friendly way for you to tie a company’s story and your key assumptions, such as future revenue, earnings, margins, and risks, directly to a financial forecast. This is then translated into a personalized fair value for the stock.
Unlike static models, Narratives highlight how the latest news or earnings change the outlook, so your analysis is always live and relevant. Narratives are available to anyone in the Simply Wall St Community page, where millions of investors already share perspectives and update their Narratives in real time.
By comparing each Narrative’s fair value with Hologic’s current price, you can easily decide if it might be time to buy, hold, or sell, based on your own outlook and risk tolerance.
For example, looking at Hologic today, some investors are optimistic. Reflecting the view that innovation in diagnostics and AI will power strong growth, they arrive at a fair value as high as $94 per share. Others, more cautious about challenges in key markets, estimate the value much lower at $65. Narratives capture both views so you can decide which story matches your own.
Do you think there's more to the story for Hologic? Create your own Narrative to let the Community know!

This article by Simply Wall St is general in nature. We provide commentary based on historical data and analyst forecasts only using an unbiased methodology and our articles are not intended to be financial advice. It does not constitute a recommendation to buy or sell any stock, and does not take account of your objectives, or your financial situation. We aim to bring you long-term focused analysis driven by fundamental data. Note that our analysis may not factor in the latest price-sensitive company announcements or qualitative material. Simply Wall St has no position in any stocks mentioned.
Valuation is complex, but we're here to simplify it.
Discover if Hologic might be undervalued or overvalued with our detailed analysis, featuring fair value estimates, potential risks, dividends, insider trades, and its financial condition.
Access Free AnalysisHave feedback on this article? Concerned about the content? Get in touch with us directly. Alternatively, email editorial-team@simplywallst.com
About NasdaqGS:HOLX
Hologic
Engages in the development, manufacture, and supply of diagnostics products, medical imaging systems, and surgical products for women's health through early detection and treatment worldwide.
Flawless balance sheet and undervalued.
Similar Companies
Market Insights

Advertisement
Community Narratives
A formidable player in AI and enterprise computing.
Fair Value US$210.00|0.7% overvalued
CO
Community Contributor
IREN's Bold Moves in Sustainable Bitcoin Mining & AI Data Centers
Fair Value US$72.52|14.9% undervalued
BL
Community Contributor
Cooling the Champions: The Aussie Tech Behind F1's Victories
Fair Value AU$12.40|38.1% undervalued
TR
Community Contributor