- United States
- /
- Healthcare Services
- /
- NasdaqGS:ENSG
Ensign Group (NASDAQ:ENSG) Seems To Use Debt Quite Sensibly


Some say volatility, rather than debt, is the best way to think about risk as an investor, but Warren Buffett famously said that 'Volatility is far from synonymous with risk.' It's only natural to consider a company's balance sheet when you examine how risky it is, since debt is often involved when a business collapses. We can see that The Ensign Group, Inc. (NASDAQ:ENSG) does use debt in its business. But is this debt a concern to shareholders?
When Is Debt Dangerous?
Generally speaking, debt only becomes a real problem when a company can't easily pay it off, either by raising capital or with its own cash flow. In the worst case scenario, a company can go bankrupt if it cannot pay its creditors. However, a more frequent (but still costly) occurrence is where a company must issue shares at bargain-basement prices, permanently diluting shareholders, just to shore up its balance sheet. Of course, plenty of companies use debt to fund growth, without any negative consequences. The first thing to do when considering how much debt a business uses is to look at its cash and debt together.
See our latest analysis for Ensign Group
What Is Ensign Group's Net Debt?
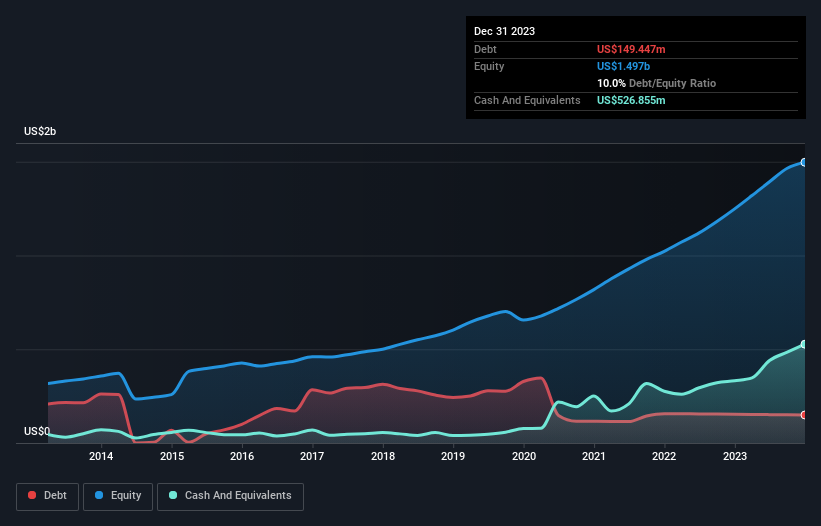
The chart below, which you can click on for greater detail, shows that Ensign Group had US$149.4m in debt in December 2023; about the same as the year before. But on the other hand it also has US$526.9m in cash, leading to a US$377.4m net cash position.
A Look At Ensign Group's Liabilities
The latest balance sheet data shows that Ensign Group had liabilities of US$734.7m due within a year, and liabilities of US$1.95b falling due after that. Offsetting this, it had US$526.9m in cash and US$485.0m in receivables that were due within 12 months. So its liabilities total US$1.67b more than the combination of its cash and short-term receivables.
While this might seem like a lot, it is not so bad since Ensign Group has a market capitalization of US$6.95b, and so it could probably strengthen its balance sheet by raising capital if it needed to. But it's clear that we should definitely closely examine whether it can manage its debt without dilution. Despite its noteworthy liabilities, Ensign Group boasts net cash, so it's fair to say it does not have a heavy debt load!
But the bad news is that Ensign Group has seen its EBIT plunge 14% in the last twelve months. If that rate of decline in earnings continues, the company could find itself in a tight spot. When analysing debt levels, the balance sheet is the obvious place to start. But ultimately the future profitability of the business will decide if Ensign Group can strengthen its balance sheet over time. So if you're focused on the future you can check out this free report showing analyst profit forecasts.
Finally, a company can only pay off debt with cold hard cash, not accounting profits. While Ensign Group has net cash on its balance sheet, it's still worth taking a look at its ability to convert earnings before interest and tax (EBIT) to free cash flow, to help us understand how quickly it is building (or eroding) that cash balance. During the last three years, Ensign Group produced sturdy free cash flow equating to 51% of its EBIT, about what we'd expect. This free cash flow puts the company in a good position to pay down debt, when appropriate.
Summing Up
Although Ensign Group's balance sheet isn't particularly strong, due to the total liabilities, it is clearly positive to see that it has net cash of US$377.4m. So we are not troubled with Ensign Group's debt use. Above most other metrics, we think its important to track how fast earnings per share is growing, if at all. If you've also come to that realization, you're in luck, because today you can view this interactive graph of Ensign Group's earnings per share history for free.
At the end of the day, it's often better to focus on companies that are free from net debt. You can access our special list of such companies (all with a track record of profit growth). It's free.
Valuation is complex, but we're here to simplify it.
Discover if Ensign Group might be undervalued or overvalued with our detailed analysis, featuring fair value estimates, potential risks, dividends, insider trades, and its financial condition.
Access Free AnalysisHave feedback on this article? Concerned about the content? Get in touch with us directly. Alternatively, email editorial-team (at) simplywallst.com.
This article by Simply Wall St is general in nature. We provide commentary based on historical data and analyst forecasts only using an unbiased methodology and our articles are not intended to be financial advice. It does not constitute a recommendation to buy or sell any stock, and does not take account of your objectives, or your financial situation. We aim to bring you long-term focused analysis driven by fundamental data. Note that our analysis may not factor in the latest price-sensitive company announcements or qualitative material. Simply Wall St has no position in any stocks mentioned.
About NasdaqGS:ENSG
Ensign Group
Provides skilled nursing, senior living, and rehabilitative services.
Excellent balance sheet and fair value.

