
Advertisement

The external fund manager backed by Berkshire Hathaway's Charlie Munger, Li Lu, makes no bones about it when he says 'The biggest investment risk is not the volatility of prices, but whether you will suffer a permanent loss of capital.' When we think about how risky a company is, we always like to look at its use of debt, since debt overload can lead to ruin. We can see that CareCloud, Inc. (NASDAQ:CCLD) does use debt in its business. But the real question is whether this debt is making the company risky.
When Is Debt A Problem?
Debt assists a business until the business has trouble paying it off, either with new capital or with free cash flow. In the worst case scenario, a company can go bankrupt if it cannot pay its creditors. While that is not too common, we often do see indebted companies permanently diluting shareholders because lenders force them to raise capital at a distressed price. By replacing dilution, though, debt can be an extremely good tool for businesses that need capital to invest in growth at high rates of return. The first thing to do when considering how much debt a business uses is to look at its cash and debt together.
View our latest analysis for CareCloud
What Is CareCloud's Debt?
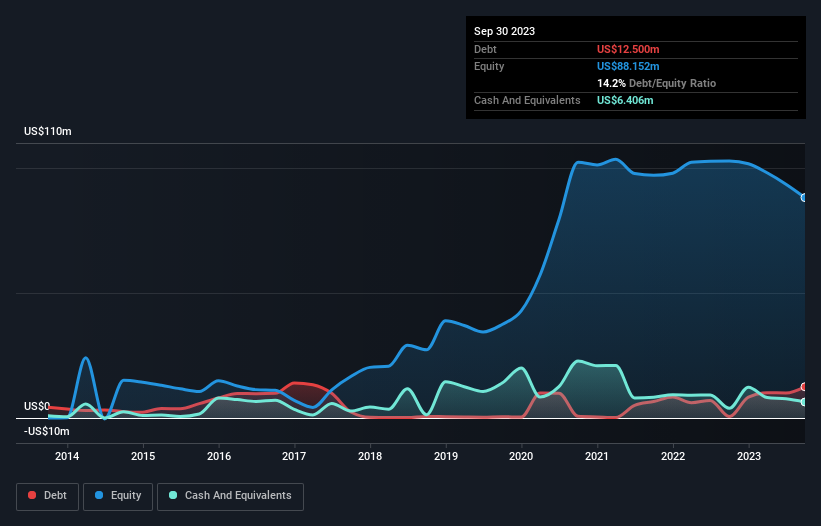
You can click the graphic below for the historical numbers, but it shows that as of September 2023 CareCloud had US$12.5m of debt, an increase on US$566.0k, over one year. On the flip side, it has US$6.41m in cash leading to net debt of about US$6.09m.
How Strong Is CareCloud's Balance Sheet?
We can see from the most recent balance sheet that CareCloud had liabilities of US$21.9m falling due within a year, and liabilities of US$15.8m due beyond that. On the other hand, it had cash of US$6.41m and US$17.3m worth of receivables due within a year. So its liabilities outweigh the sum of its cash and (near-term) receivables by US$14.1m.
This deficit is considerable relative to its market capitalization of US$21.2m, so it does suggest shareholders should keep an eye on CareCloud's use of debt. Should its lenders demand that it shore up the balance sheet, shareholders would likely face severe dilution. The balance sheet is clearly the area to focus on when you are analysing debt. But ultimately the future profitability of the business will decide if CareCloud can strengthen its balance sheet over time. So if you're focused on the future you can check out this free report showing analyst profit forecasts.
Over 12 months, CareCloud made a loss at the EBIT level, and saw its revenue drop to US$121m, which is a fall of 16%. We would much prefer see growth.
Caveat Emptor
While CareCloud's falling revenue is about as heartwarming as a wet blanket, arguably its earnings before interest and tax (EBIT) loss is even less appealing. Its EBIT loss was a whopping US$2.5m. When we look at that and recall the liabilities on its balance sheet, relative to cash, it seems unwise to us for the company to have any debt. So we think its balance sheet is a little strained, though not beyond repair. We would feel better if it turned its trailing twelve month loss of US$20m into a profit. In the meantime, we consider the stock very risky. The balance sheet is clearly the area to focus on when you are analysing debt. But ultimately, every company can contain risks that exist outside of the balance sheet. Be aware that CareCloud is showing 4 warning signs in our investment analysis , and 1 of those doesn't sit too well with us...
Of course, if you're the type of investor who prefers buying stocks without the burden of debt, then don't hesitate to discover our exclusive list of net cash growth stocks, today.
New: AI Stock Screener & Alerts
Our new AI Stock Screener scans the market every day to uncover opportunities.
• Dividend Powerhouses (3%+ Yield)
• Undervalued Small Caps with Insider Buying
• High growth Tech and AI Companies
Or build your own from over 50 metrics.
Have feedback on this article? Concerned about the content? Get in touch with us directly. Alternatively, email editorial-team (at) simplywallst.com.
This article by Simply Wall St is general in nature. We provide commentary based on historical data and analyst forecasts only using an unbiased methodology and our articles are not intended to be financial advice. It does not constitute a recommendation to buy or sell any stock, and does not take account of your objectives, or your financial situation. We aim to bring you long-term focused analysis driven by fundamental data. Note that our analysis may not factor in the latest price-sensitive company announcements or qualitative material. Simply Wall St has no position in any stocks mentioned.
About NasdaqGM:CCLD
CareCloud
A healthcare information technology (IT) company, provides technology-enabled business solutions, Software-as-a-Service offerings, and related business services to healthcare providers and hospitals primarily in the United States.
Flawless balance sheet and good value.
Similar Companies
Market Insights

Advertisement
Community Narratives
The Most Undervalued of the Magnificent 7
Fair Value US$237.43|35.4% undervalued
IN
Community Contributor
PVA TePla's New Strategy Aims for 22% Revenue Growth in Semiconductor Recovery
Fair Value €19.19|20.3% undervalued
MI
Community Contributor