Advertisement
- United States
- /
- Food
- /
- NYSE:SJM
What the Latest 11% Drop Means for J. M. Smucker in 2025

Simply Wall St
Reviewed by Bailey Pemberton
If you’ve got your eye on J. M. Smucker lately and you’re wondering if now’s the right time to buy, hold, or move on, you’re not alone. It’s a name that sits squarely in many investors’ portfolios, and yet the stock has had an eventful ride. Just in the past week, shares dipped by 2.3%, and over the past year, they’ve dropped 11.4%. If you broaden the lens, the five-year return peeks into the green at 6.5%, hinting at both resilience and ongoing market uncertainty.
Some of that movement traces back to broad shifts in the packaged food space, where shifting consumer preferences and ingredient cost swings have kept markets guessing. In the midst of this, J. M. Smucker’s current value score is 3 out of 6, suggesting it's undervalued in half of the key metrics analysts watch. That’s not just a number; it’s your first clue that the story may be more nuanced than the pure performance stats might suggest.
So what goes into that value score, and does it really capture what’s happening on the ground for Smucker investors? Let’s walk through the company’s valuation from a few trusted angles, and stay tuned for an even sharper lens for figuring out what this stock is really worth.
Approach 1: J. M. Smucker Discounted Cash Flow (DCF) Analysis
A Discounted Cash Flow (DCF) model estimates a company’s intrinsic value by projecting its future cash flows and discounting them to today’s dollars, giving investors a peek into what the business may truly be worth. For J. M. Smucker, analysts have calculated a last twelve months free cash flow of $533.5 million. Looking ahead, free cash flow is projected to hit $1.22 billion by 2028, with a ten-year forecast topping $1.6 billion. While analyst input drives the first five years, later estimates use reasonable growth extrapolations and present a picture of steady expansion.
Under this DCF approach, Smucker’s fair value is pegged at $306.82 per share. This suggests the stock trades at a steep 66.3% discount to its intrinsic value, making it appear significantly undervalued according to this measure.
Result: UNDERVALUED
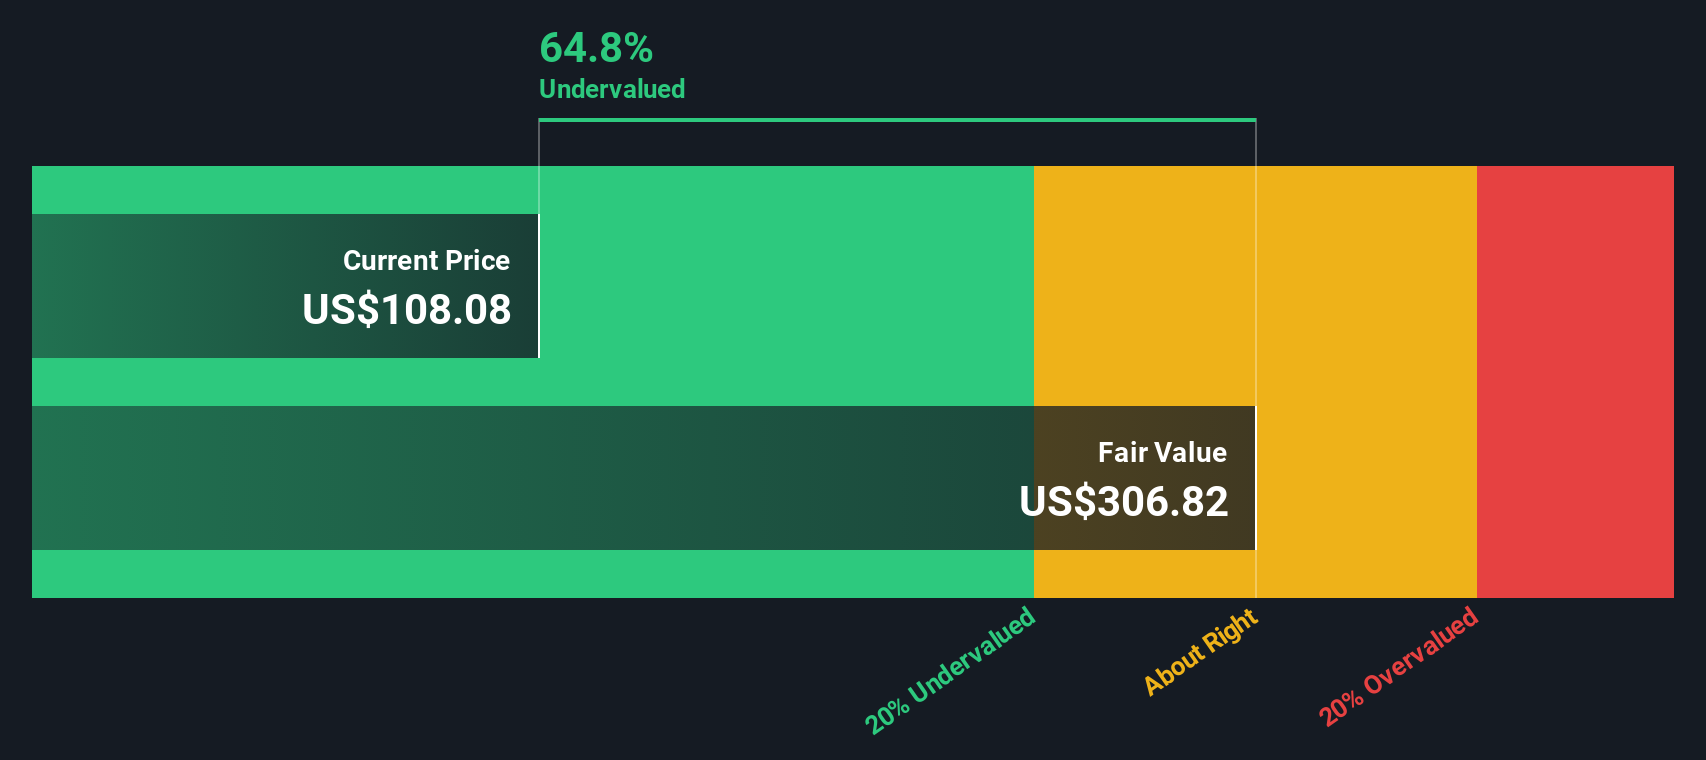
Our Discounted Cash Flow (DCF) analysis suggests J. M. Smucker is undervalued by 66.3%. Track this in your watchlist or portfolio, or discover more undervalued stocks.
Approach 2: J. M. Smucker Price vs Sales
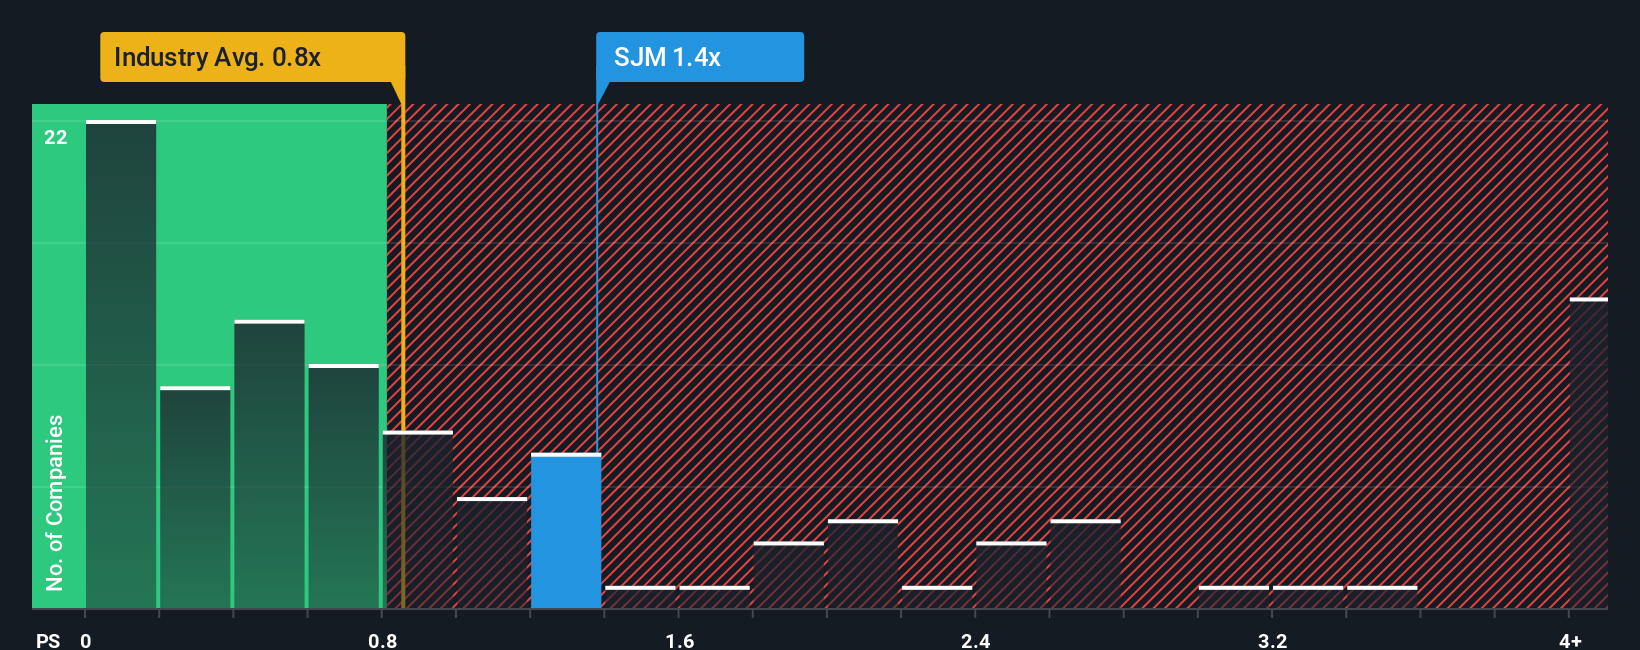
The Price-to-Sales (P/S) ratio is a widely used valuation metric for companies in industries like packaged foods, where profit margins can fluctuate but sales revenue remains a steady indicator of business strength. It is especially useful for assessing companies that are profitable, as it gives investors a sense of how much they are paying for every dollar of a company’s sales.
Generally, factors such as expected revenue growth and perceived risk play a big role in what should be considered a fair P/S ratio. Companies with solid growth prospects or lower risk profiles typically justify higher P/S multiples, while companies facing headwinds or slower growth usually trade at lower multiples.
Currently, J. M. Smucker trades at a P/S ratio of 1.27x. For context, this is higher than the average peer group P/S of 0.66x and above the broader food industry average of 0.89x. However, Simply Wall St’s proprietary "Fair Ratio" stands at 1.30x, which takes a deeper dive into fundamentals such as profit margins, recent growth, risk profile, market cap, and industry trends. Unlike simple comparisons to peers or broad industry metrics, the Fair Ratio is designed to reflect what multiple the company actually deserves and provides a more accurate picture.
In this case, Smucker’s actual P/S multiple is nearly identical to the Fair Ratio. This alignment suggests that the stock’s valuation based on sales is fair given its specific characteristics and outlook.
Result: ABOUT RIGHT
PS ratios tell one story, but what if the real opportunity lies elsewhere? Discover companies where insiders are betting big on explosive growth.
Upgrade Your Decision Making: Choose your J. M. Smucker Narrative
Earlier, we mentioned that there is an even better way to understand valuation, so let's introduce you to Narratives. A Narrative connects the dots between the company’s story—your view on its brands, strategy, and industry—its future financial forecasts, and your resulting fair value estimate. Rather than just crunching numbers, Narratives let investors give context to those numbers by defining assumptions about revenue growth, profit margins, and future earnings, all informed by what they believe will truly shape the business.
Narratives make this process accessible and interactive on Simply Wall St’s Community page, where millions of investors can create, share, and follow different views about J. M. Smucker’s future, and see how those stories translate to estimated fair value and buy/sell decisions as new news and earnings updates come in. By comparing your calculated Fair Value to the current share price, you can quickly see if your personal scenario indicates a buying opportunity or if you’re better off holding or selling. For example, some J. M. Smucker investors with a bullish narrative forecast higher coffee segment strength, expect 2028 earnings over $980 million, and see fair value as high as $130 per share. More bearish investors, concerned about ongoing tariff and margin pressure, see fair value closer to $105 per share.
Do you think there's more to the story for J. M. Smucker? Create your own Narrative to let the Community know!

This article by Simply Wall St is general in nature. We provide commentary based on historical data and analyst forecasts only using an unbiased methodology and our articles are not intended to be financial advice. It does not constitute a recommendation to buy or sell any stock, and does not take account of your objectives, or your financial situation. We aim to bring you long-term focused analysis driven by fundamental data. Note that our analysis may not factor in the latest price-sensitive company announcements or qualitative material. Simply Wall St has no position in any stocks mentioned.
New: Manage All Your Stock Portfolios in One Place
We've created the ultimate portfolio companion for stock investors, and it's free.
• Connect an unlimited number of Portfolios and see your total in one currency
• Be alerted to new Warning Signs or Risks via email or mobile
• Track the Fair Value of your stocks
Have feedback on this article? Concerned about the content? Get in touch with us directly. Alternatively, email editorial-team@simplywallst.com
About NYSE:SJM
J. M. Smucker
Manufactures and markets branded food and beverage products worldwide.
Average dividend payer and fair value.
Similar Companies
Market Insights

Advertisement
Community Narratives
A formidable player in AI and enterprise computing.
Fair Value US$210.00|13.6% overvalued
CO
Community Contributor
IREN's Bold Moves in Sustainable Bitcoin Mining & AI Data Centers
Fair Value US$89.00|23.6% undervalued
BL
Community Contributor
Cooling the Champions: The Aussie Tech Behind F1's Victories
Fair Value AU$12.40|37.6% undervalued
TR
Community Contributor