
Advertisement
- United States
- /
- Food
- /
- NYSE:SJM
The J. M. Smucker Company (NYSE:SJM) Shares Could Be 47% Below Their Intrinsic Value Estimate

Key Insights
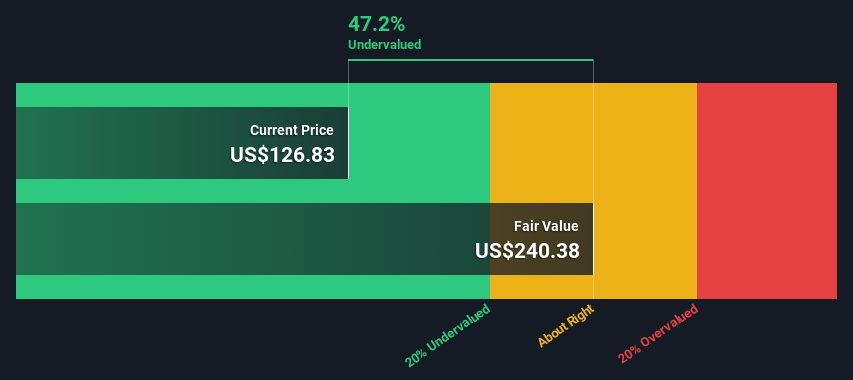
- J. M. Smucker's estimated fair value is US$240 based on 2 Stage Free Cash Flow to Equity
- J. M. Smucker is estimated to be 47% undervalued based on current share price of US$127
- The US$144 analyst price target for SJM is 40% less than our estimate of fair value
Today we'll do a simple run through of a valuation method used to estimate the attractiveness of The J. M. Smucker Company (NYSE:SJM) as an investment opportunity by taking the expected future cash flows and discounting them to their present value. One way to achieve this is by employing the Discounted Cash Flow (DCF) model. It may sound complicated, but actually it is quite simple!
Remember though, that there are many ways to estimate a company's value, and a DCF is just one method. For those who are keen learners of equity analysis, the Simply Wall St analysis model here may be something of interest to you.
View our latest analysis for J. M. Smucker
What's The Estimated Valuation?
We are going to use a two-stage DCF model, which, as the name states, takes into account two stages of growth. The first stage is generally a higher growth period which levels off heading towards the terminal value, captured in the second 'steady growth' period. To begin with, we have to get estimates of the next ten years of cash flows. Where possible we use analyst estimates, but when these aren't available we extrapolate the previous free cash flow (FCF) from the last estimate or reported value. We assume companies with shrinking free cash flow will slow their rate of shrinkage, and that companies with growing free cash flow will see their growth rate slow, over this period. We do this to reflect that growth tends to slow more in the early years than it does in later years.
A DCF is all about the idea that a dollar in the future is less valuable than a dollar today, so we need to discount the sum of these future cash flows to arrive at a present value estimate:
10-year free cash flow (FCF) forecast
| 2024 | 2025 | 2026 | 2027 | 2028 | 2029 | 2030 | 2031 | 2032 | 2033 | |
| Levered FCF ($, Millions) | US$712.3m | US$957.0m | US$1.08b | US$1.07b | US$1.09b | US$1.11b | US$1.13b | US$1.15b | US$1.18b | US$1.20b |
| Growth Rate Estimate Source | Analyst x4 | Analyst x6 | Analyst x6 | Analyst x1 | Analyst x1 | Est @ 1.90% | Est @ 1.97% | Est @ 2.03% | Est @ 2.06% | Est @ 2.09% |
| Present Value ($, Millions) Discounted @ 6.2% | US$671 | US$849 | US$903 | US$840 | US$807 | US$775 | US$744 | US$716 | US$688 | US$662 |
("Est" = FCF growth rate estimated by Simply Wall St)
Present Value of 10-year Cash Flow (PVCF) = US$7.7b
After calculating the present value of future cash flows in the initial 10-year period, we need to calculate the Terminal Value, which accounts for all future cash flows beyond the first stage. For a number of reasons a very conservative growth rate is used that cannot exceed that of a country's GDP growth. In this case we have used the 5-year average of the 10-year government bond yield (2.2%) to estimate future growth. In the same way as with the 10-year 'growth' period, we discount future cash flows to today's value, using a cost of equity of 6.2%.
Terminal Value (TV)= FCF2033 × (1 + g) ÷ (r – g) = US$1.2b× (1 + 2.2%) ÷ (6.2%– 2.2%) = US$31b
Present Value of Terminal Value (PVTV)= TV / (1 + r)10= US$31b÷ ( 1 + 6.2%)10= US$17b
The total value, or equity value, is then the sum of the present value of the future cash flows, which in this case is US$25b. To get the intrinsic value per share, we divide this by the total number of shares outstanding. Compared to the current share price of US$127, the company appears quite good value at a 47% discount to where the stock price trades currently. Valuations are imprecise instruments though, rather like a telescope - move a few degrees and end up in a different galaxy. Do keep this in mind.
Important Assumptions
We would point out that the most important inputs to a discounted cash flow are the discount rate and of course the actual cash flows. You don't have to agree with these inputs, I recommend redoing the calculations yourself and playing with them. The DCF also does not consider the possible cyclicality of an industry, or a company's future capital requirements, so it does not give a full picture of a company's potential performance. Given that we are looking at J. M. Smucker as potential shareholders, the cost of equity is used as the discount rate, rather than the cost of capital (or weighted average cost of capital, WACC) which accounts for debt. In this calculation we've used 6.2%, which is based on a levered beta of 0.800. Beta is a measure of a stock's volatility, compared to the market as a whole. We get our beta from the industry average beta of globally comparable companies, with an imposed limit between 0.8 and 2.0, which is a reasonable range for a stable business.
SWOT Analysis for J. M. Smucker
Strength
- Debt is well covered by earnings and cashflows.
Weakness
- Dividend is low compared to the top 25% of dividend payers in the Food market.
Opportunity
- Expected to breakeven next year.
- Has sufficient cash runway for more than 3 years based on current free cash flows.
- Trading below our estimate of fair value by more than 20%.
Threat
- Paying a dividend but company is unprofitable.
- Revenue is forecast to decrease over the next 2 years.
Moving On:
Valuation is only one side of the coin in terms of building your investment thesis, and it shouldn't be the only metric you look at when researching a company. The DCF model is not a perfect stock valuation tool. Instead the best use for a DCF model is to test certain assumptions and theories to see if they would lead to the company being undervalued or overvalued. For example, changes in the company's cost of equity or the risk free rate can significantly impact the valuation. What is the reason for the share price sitting below the intrinsic value? For J. M. Smucker, there are three relevant aspects you should assess:
- Risks: For example, we've discovered 3 warning signs for J. M. Smucker that you should be aware of before investing here.
- Future Earnings: How does SJM's growth rate compare to its peers and the wider market? Dig deeper into the analyst consensus number for the upcoming years by interacting with our free analyst growth expectation chart.
- Other Solid Businesses: Low debt, high returns on equity and good past performance are fundamental to a strong business. Why not explore our interactive list of stocks with solid business fundamentals to see if there are other companies you may not have considered!
PS. Simply Wall St updates its DCF calculation for every American stock every day, so if you want to find the intrinsic value of any other stock just search here.
New: Manage All Your Stock Portfolios in One Place
We've created the ultimate portfolio companion for stock investors, and it's free.
• Connect an unlimited number of Portfolios and see your total in one currency
• Be alerted to new Warning Signs or Risks via email or mobile
• Track the Fair Value of your stocks
Have feedback on this article? Concerned about the content? Get in touch with us directly. Alternatively, email editorial-team (at) simplywallst.com.
This article by Simply Wall St is general in nature. We provide commentary based on historical data and analyst forecasts only using an unbiased methodology and our articles are not intended to be financial advice. It does not constitute a recommendation to buy or sell any stock, and does not take account of your objectives, or your financial situation. We aim to bring you long-term focused analysis driven by fundamental data. Note that our analysis may not factor in the latest price-sensitive company announcements or qualitative material. Simply Wall St has no position in any stocks mentioned.
About NYSE:SJM
J. M. Smucker
Manufactures and markets branded food and beverage products worldwide.
Average dividend payer and fair value.
Similar Companies
Market Insights


Advertisement
Community Narratives
Nike's Direct-to-Consumer Focus Will Drive Future Growth
Fair Value US$87.90|18.2% undervalued
UN
Community Contributor
Novo Nordisk will dominate GLP-1 market with Ozempic and Wegovy growth
Fair Value US$89.59|12.1% undervalued
BE
Community Contributor
Rheinmetall could get 20-25% of EU-NATO 3%-GDP defence spending
Fair Value €7.57k|82.4% undervalued
NO
Community Contributor