- United States
- /
- Beverage
- /
- NYSE:KOF
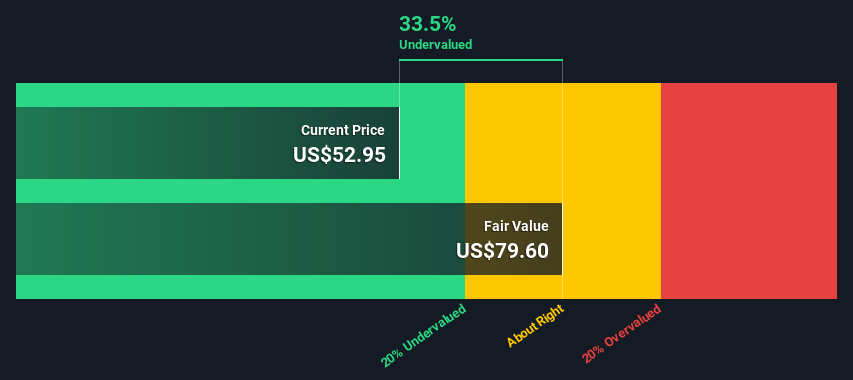
Is There An Opportunity With Coca-Cola FEMSA, S.A.B. de C.V.'s (NYSE:KOF) 33% Undervaluation?

Today we'll do a simple run through of a valuation method used to estimate the attractiveness of Coca-Cola FEMSA, S.A.B. de C.V. (NYSE:KOF) as an investment opportunity by taking the expected future cash flows and discounting them to today's value. We will take advantage of the Discounted Cash Flow (DCF) model for this purpose. There's really not all that much to it, even though it might appear quite complex.
Companies can be valued in a lot of ways, so we would point out that a DCF is not perfect for every situation. If you want to learn more about discounted cash flow, the rationale behind this calculation can be read in detail in the Simply Wall St analysis model.
See our latest analysis for Coca-Cola FEMSA. de
Step by step through the calculation
We use what is known as a 2-stage model, which simply means we have two different periods of growth rates for the company's cash flows. Generally the first stage is higher growth, and the second stage is a lower growth phase. To start off with, we need to estimate the next ten years of cash flows. Where possible we use analyst estimates, but when these aren't available we extrapolate the previous free cash flow (FCF) from the last estimate or reported value. We assume companies with shrinking free cash flow will slow their rate of shrinkage, and that companies with growing free cash flow will see their growth rate slow, over this period. We do this to reflect that growth tends to slow more in the early years than it does in later years.
Generally we assume that a dollar today is more valuable than a dollar in the future, so we discount the value of these future cash flows to their estimated value in today's dollars:
10-year free cash flow (FCF) estimate
| 2022 | 2023 | 2024 | 2025 | 2026 | 2027 | 2028 | 2029 | 2030 | 2031 | |
| Levered FCF (MX$, Millions) | Mex$16.1b | Mex$17.3b | Mex$17.5b | Mex$19.0b | Mex$19.8b | Mex$20.5b | Mex$21.1b | Mex$21.7b | Mex$22.2b | Mex$22.8b |
| Growth Rate Estimate Source | Analyst x5 | Analyst x5 | Analyst x2 | Analyst x2 | Est @ 4.14% | Est @ 3.5% | Est @ 3.05% | Est @ 2.73% | Est @ 2.51% | Est @ 2.35% |
| Present Value (MX$, Millions) Discounted @ 7.5% | Mex$15.0k | Mex$15.0k | Mex$14.1k | Mex$14.2k | Mex$13.8k | Mex$13.3k | Mex$12.7k | Mex$12.1k | Mex$11.6k | Mex$11.0k |
("Est" = FCF growth rate estimated by Simply Wall St)
Present Value of 10-year Cash Flow (PVCF) = Mex$133b
The second stage is also known as Terminal Value, this is the business's cash flow after the first stage. For a number of reasons a very conservative growth rate is used that cannot exceed that of a country's GDP growth. In this case we have used the 5-year average of the 10-year government bond yield (2.0%) to estimate future growth. In the same way as with the 10-year 'growth' period, we discount future cash flows to today's value, using a cost of equity of 7.5%.
Terminal Value (TV)= FCF2031 × (1 + g) ÷ (r – g) = Mex$23b× (1 + 2.0%) ÷ (7.5%– 2.0%) = Mex$419b
Present Value of Terminal Value (PVTV)= TV / (1 + r)10= Mex$419b÷ ( 1 + 7.5%)10= Mex$202b
The total value is the sum of cash flows for the next ten years plus the discounted terminal value, which results in the Total Equity Value, which in this case is Mex$335b. In the final step we divide the equity value by the number of shares outstanding. Compared to the current share price of US$53.0, the company appears quite good value at a 33% discount to where the stock price trades currently. Valuations are imprecise instruments though, rather like a telescope - move a few degrees and end up in a different galaxy. Do keep this in mind.
Important assumptions
The calculation above is very dependent on two assumptions. The first is the discount rate and the other is the cash flows. Part of investing is coming up with your own evaluation of a company's future performance, so try the calculation yourself and check your own assumptions. The DCF also does not consider the possible cyclicality of an industry, or a company's future capital requirements, so it does not give a full picture of a company's potential performance. Given that we are looking at Coca-Cola FEMSA. de as potential shareholders, the cost of equity is used as the discount rate, rather than the cost of capital (or weighted average cost of capital, WACC) which accounts for debt. In this calculation we've used 7.5%, which is based on a levered beta of 0.885. Beta is a measure of a stock's volatility, compared to the market as a whole. We get our beta from the industry average beta of globally comparable companies, with an imposed limit between 0.8 and 2.0, which is a reasonable range for a stable business.
Looking Ahead:
Although the valuation of a company is important, it is only one of many factors that you need to assess for a company. The DCF model is not a perfect stock valuation tool. Instead the best use for a DCF model is to test certain assumptions and theories to see if they would lead to the company being undervalued or overvalued. If a company grows at a different rate, or if its cost of equity or risk free rate changes sharply, the output can look very different. Can we work out why the company is trading at a discount to intrinsic value? For Coca-Cola FEMSA. de, we've put together three relevant elements you should further examine:
- Risks: For example, we've discovered 2 warning signs for Coca-Cola FEMSA. de that you should be aware of before investing here.
- Future Earnings: How does KOF's growth rate compare to its peers and the wider market? Dig deeper into the analyst consensus number for the upcoming years by interacting with our free analyst growth expectation chart.
- Other High Quality Alternatives: Do you like a good all-rounder? Explore our interactive list of high quality stocks to get an idea of what else is out there you may be missing!
PS. The Simply Wall St app conducts a discounted cash flow valuation for every stock on the NYSE every day. If you want to find the calculation for other stocks just search here.
When trading Coca-Cola FEMSA. de or any other investment, use the platform considered by many to be the Professional's Gateway to the Worlds Market, Interactive Brokers. You get the lowest-cost* trading on stocks, options, futures, forex, bonds and funds worldwide from a single integrated account. Promoted
New: AI Stock Screener & Alerts
Our new AI Stock Screener scans the market every day to uncover opportunities.
• Dividend Powerhouses (3%+ Yield)
• Undervalued Small Caps with Insider Buying
• High growth Tech and AI Companies
Or build your own from over 50 metrics.
This article by Simply Wall St is general in nature. It does not constitute a recommendation to buy or sell any stock, and does not take account of your objectives, or your financial situation. We aim to bring you long-term focused analysis driven by fundamental data. Note that our analysis may not factor in the latest price-sensitive company announcements or qualitative material. Simply Wall St has no position in any stocks mentioned.
*Interactive Brokers Rated Lowest Cost Broker by StockBrokers.com Annual Online Review 2020
Have feedback on this article? Concerned about the content? Get in touch with us directly. Alternatively, email editorial-team (at) simplywallst.com.
About NYSE:KOF
Coca-Cola FEMSA. de
A franchise bottler, produces, markets, sells, and distributes Coca-Cola trademark beverages in Mexico, Guatemala, Nicaragua, Costa Rica, Panama, Colombia, Brazil, Argentina, and Uruguay.
Undervalued with excellent balance sheet and pays a dividend.
Similar Companies
Market Insights

Community Narratives

